20,233 views
 In Memory Fuzzing
Introduction
In memory fuzzing is a technique that allows the analyst to bypass parsers; network-related limitations such as max connections, buit-in IDS or flooding protection; encrypted or unknown (poorly documented) protocol in order to fuzz the actual underlying assembly routines that are potentially vulnerable.
Prior to the development of my fuzzing toolset, I was unsatisfied (for now) with all the publicly available in memory fuzzers, because most of them are just too basic and require too much prep time in advance — flow analysis, reverse code engineering, etc — which obviously has a high learning curve and time consuming tasks, and most people would rather just stick with traditional fuzzers (which usually can accomplish the exact same thing). Yes, you DO need some reversing skills to make in memory fuzzing useful, but honestly it doesn’t really have to be all that difficult to start fuzzing and find bugs… as long as you have the right approach.
One of the approaches we do here is by tracing user input automatically at real time, and log all the important functions that process that input, and then fuzz them. A proof of concept (Tracer.py and InMemoryFuzzer.py) is also available to download:
http://redmine.corelan.be/projects/inmemoryfuzzing
Special thanks to:
- Peter Van Eeckhoutte, and members of Corelan Security
- Offensive Security Exploit Database
- dookie2000ca for all the feedback
Requirements/Setup:
In order to use these tools, you should have:
- Windows XP SP2 or SP3 (not tested on SP1), or newer
- IDA 4.9, or pvefindaddr. The difference is pvefindaddr is more automatic, IDA isn’t. IDA, however, will find all/more functions though
- Python 2.5.0 (installed from Immunity Debugger)
- Pydasm: http://therning.org/magnus/archive/278
- Paimei: http://www.openrce.org/downloads/details/208/PaiMei
Pydbg is probably the trickiest to install so we’ll go throughly the steps briefly:
- Install Python 2.5. The one I tested was Python 2.5 (r25:51908, Sep 19 2006)
- Download Pydasm (for Python 2.5) from the URL above.
- Download Paimei. Extract the package, go to the "installers" folder, and run the installer.
- Remove C:\Python25\Lib\site-packages\pydbg\pydasm.pyd
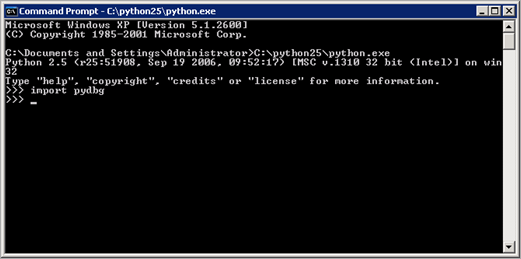
- Now you’re ready to test out Pydbg. Open command prompt, and type the following. If you no errors after importing Pydbg, that means your system now supports Pydbg:
Tracer.py: How It Works
As I previously mentioned, in order to deploy an in memory fuzzer, you must go through a good amount of analysis to identify all the functions that process your input, and log the function entry address, RETN addresses, and the argument you want to fuzz. This makes fuzzing very time consuming, simply not something that can be done in minutes. The purpose of Tracer.py is to ease off this process, allowing the user to track the control flow and user input at real time.
This is done by first searching all the function addresses in the application, put a hook point in every one of them, and then start monitoring. If a hooked function is detected, we log the function and the argument, and keep monitoring. Since this happens at real time, even with the most basic tool like this can still see some kind of pattern in the log, which gives us an idea where to fuzz.
The following example shows how to recognize this pattern in Tracer.py:
Tracer.py: How To
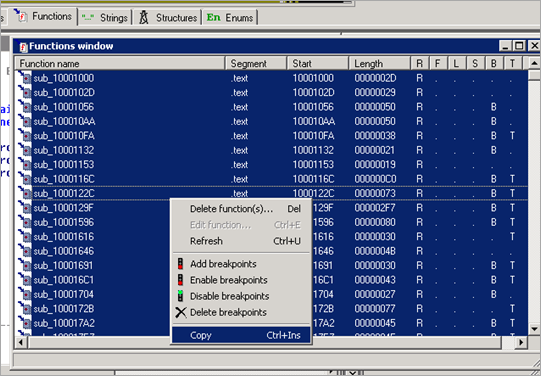
First, open IDA. If you’re using IDA 4.9 ( see image):
- Click on the Functions tab
- Select all the functions (click the first function -> hold [shift] -> select last function)
- Right click -> copy -> paste on notepad. Save it as "functions.txt" under the same directory as the script.
If you’re using IDA Pro 5.5 or higher, the Functions table should be on the left of the the pretty graph. You can do the same thing (right click -> copy and paste) to obtain all your functions that way.
Second, open the application you want to fuzz. You must do this before running the script because it needs to attach to the process first.
Third, now that you have a function list (functions.txt). Go to command prompt, and type of the following (assuming you saved Tracer.py in C:\):
C:>C:\Python25\python.exe Tracer.py
Fourth, the script should find the function list file without problems. Give it a pattern (user input) to look for, select the process you want to monitor, and the fun begins. Note that a file named "new_functions_addrs.txt" will be created — this file contains the same function addresses, and the correct RETN addresses. You can use this as a reference later for InMemoryFuzzer.py.
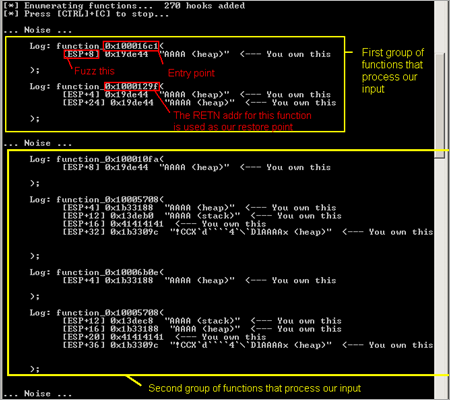
Fifth, now Tracer.py should be monitoring. Go back to the application, feed it the same pattern, and then you’ll see which functions get triggered. Press [CTRL]+[C] to terminate the script.
InMemoryFuzzer.py: How It Works
The idea of how the fuzzer works is simple. Say you have a vulnerable routine at entry 0x1001BEEF (aka snapshot point), which takes the user input as [ESP+4] at the beginning of the prologue, and that function ends at address 0x1001BFEA (restore point). We can put a breakpoint at 0x1001BEEF, another at 0x1001BFEA, and let the application run, as the following diagram demonstrates:
Wehen the execution flow hits our first breakpoint (entry) for the first time, we take a snapshot of the state (threads, stack, registers, flags, etc), modify the user input in [ESP+4], and resume execution to let the function to process our data, and hope something crashes. If an exception is thrown somewhere in the code, we log that, restore the function state, and redirect the execution flow back to the entry (0x1001BEEF), and fuzz again with a new input, like this diagram:
Or, no exception is triggered, we end up hitting the second breakpoint, then all we have to do is restore the state, rewind, and fuzz again:
InMemoryFuzzer.py: How To
Before you use the fuzzer, you should already know the following:
- Which process/dll to fuzz
- The function entry address(s) (aka your snapshot points)
- The restore point(s) (typically a RETN address)
- Which function argument(s) to fuzz
First thing, open the application you want to fuzz again. And if needed, change how many times you want to fuzz by editing the "maxFuzzCount" global variable in the source code. Please note that InMemoryFuzzer.py has two modes for fuzzing: Single routine, or multiple. Single routine mode allows the user to put every required information (function entry, restore point, argument) in one line:
C:>C:\python25\python.exe InMemoryFuzzer.py
So if we were to reuse the same example in the "How it works" section, we would be feeding the fuzzer with the following:
C:>C:\python25\python.exe InMemoryFuzzer.py 0x1001BEEF 0x1001BFEA ESP+4
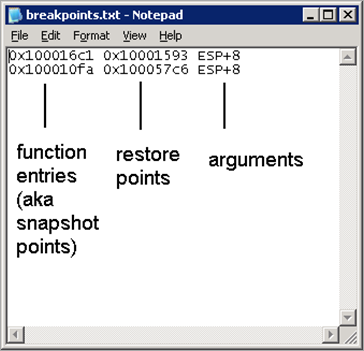
Multiple-Routine mode, which is my favorite mode, does not have to called from the command line. All you must do is prepare breakpoints.txt, which contains information such as the snapshot point/restore point/argument with the same format:
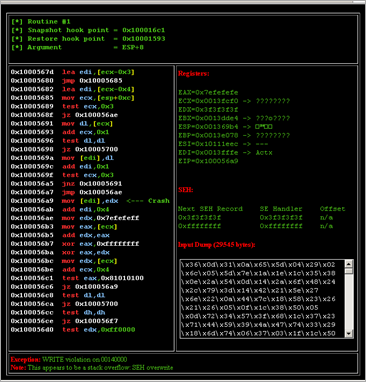
Once you have breakpoints.txt, double click on InMemoryFuzzer.py, you’ll be asked which process to attach, trigger the vulnerable routine by feeding some user input again (does not have to be the same pattern as you did for Tracer.py) and then it’ll start fuzzing once the execution flow hits our first breakpoint. When the fuzzer is complete, there should be a newly created folder named "crashbin" under the same directory as the fuzzer. Crash Bin is a place where InMemoryFuzzer.py stores all the crashes (htm files), and the inputs that caused them. Here’s an example of a crash dump:
Each crash dump contains information including:
- Function entry (snapshot point) address
- Argument
- Argument length to crash the application
- Registers (and what data they’re pointing to)
- Disassembled instruction
- SEH chains and offsets
- Input that caused the crash
After an exception is found, the rest leaves for the user to analyze. This is where IDA Pro, or Immunity Debugger becomes handy again.
Demonstration
The above video demonstration shows you how to use in memory fuzzing from vulnerability to exploitation. You can view the video here as well : http://www.youtube.com/watch?v=YhyFuAfD7C4
![]() Copyright secured by Digiprove © 2010 Peter Van Eeckhoutte
Copyright secured by Digiprove © 2010 Peter Van Eeckhoutte
© 2010 – 2021, Corelan Team (sinn3r). All rights reserved.




Pingback: Week 42 in Review – 2010 | Infosec Events