13,548 views
 Debugging Fun – Putting a process to sleep()
Introduction / Problem description
Recently I played with an older CVE (CVE-2008-0532, http://www.securityfocus.com/archive/1/489463, by FX) and I was having trouble debugging the CGI executable where the vulnerable function was located.
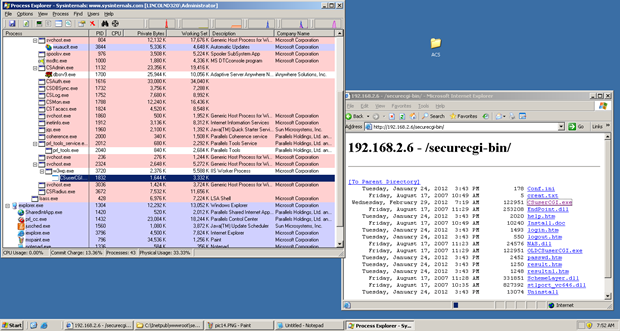
Here’s the problem : The CGI Executable CSUserCGI.exe is a child process of IIS, and only spawns when called by a user. The executable script then quickly closes after serving its purpose… and before we can attach our debugger. So how do we essentially debug this? Would configuring the debugger for JIT (Just In Time) work ?
Let’s see
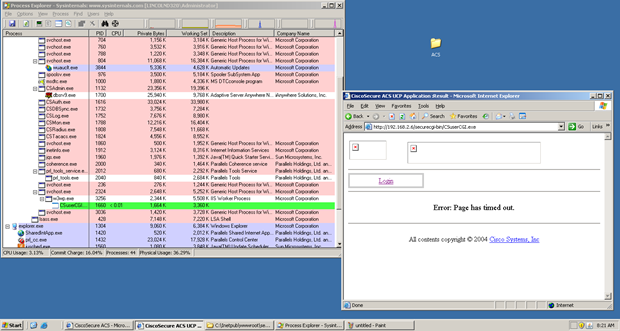
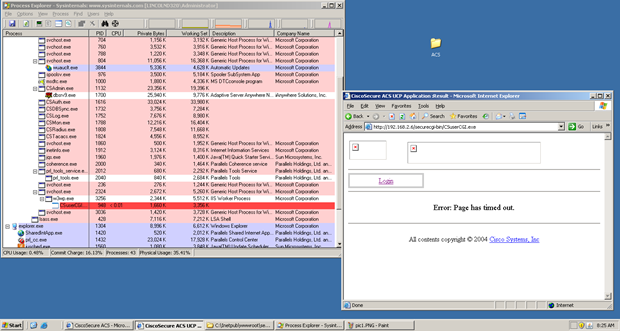
When we call the CGI script over HTTP we can see it open and close real quick.
Try #1
No luck! So How am I going to debug this? There has to be a way.
Putting the process to sleep()
At the time one of my Corelan team mates sinn3r had completed a few HP NNM modules which he encountered similar circumstances. The idea was to put the child process to sleep until I attach a debugger, by inserting some code that would do this:
// (pseudo code):

while (IsDebuggerPresent == false) {
   sleep(1);
}

// Repair the prologue of the entry point you hijacked,
// and then jmp back to the entry point.
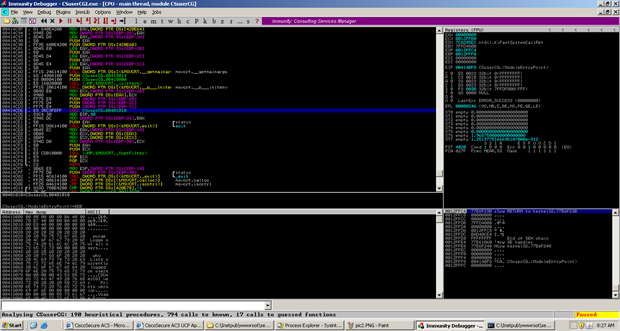
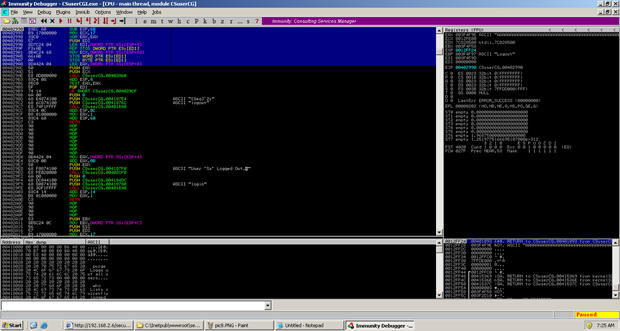
Okay made sense, so time to get my hands dirty. I opened the executable in immunity and picked a good function to hook (0x00401010). I wanted to skip some of the initial kernel calls and environment and jump right into main().
The next thing I needed to was find a place in .text that wasn’t being used by the executable and would not corrupt any other functions, or prevent the executable from working as intended. The goal would be to use the existing call instruction (call 0x00401010 in this case), and change the offset value of that call to make a jump to the location where my custom routine will be placed.
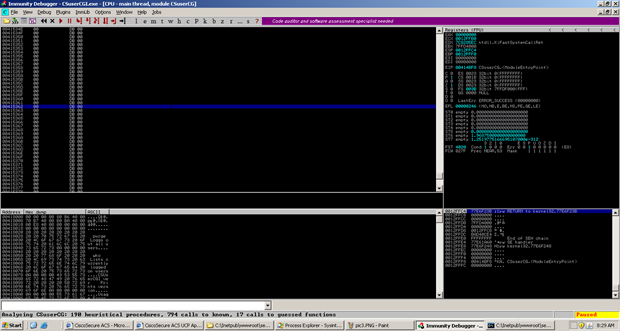
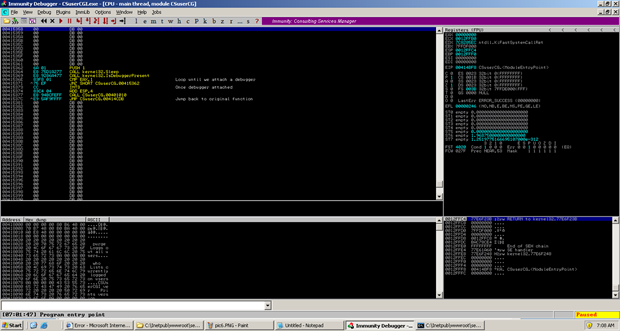
I found a nice spot at 0x00415362 so I would edit the call at 0x00414CD6 to point to that location.
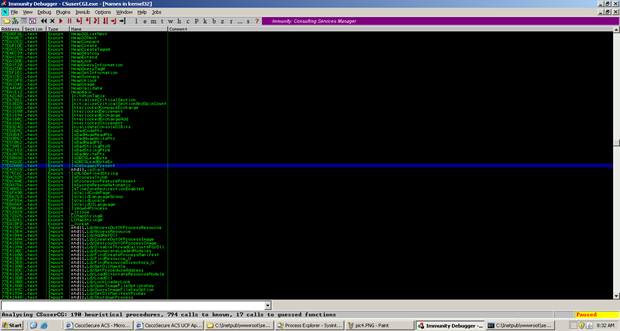
Now I need to find the location of kernel32.Sleep & kernel32.IsDebuggerPresent. Since this is just a patch I am doing locally on my system there is no need to look for a generic calls to these function, I can just look up the locations in Immunity under executable then names. On my Windows 2003 SP2 system the locations are 0x77e424de & 0x77e5da00. More than likely they will be different on your machine!
Time to insert my function hook. Note that for this particular exploit there was not a need to jump back to the next instruction after our original (now updated) call but I did it anyways.
First, I patched the call offset (to make it jump to the custom routine, which I’m going to place at 0x00415362)
00414CD6 E8 87060000 CALL CSUserCG.00415362 ; jmp to custom routine
and I placed the custom routine at 0x00415362
00415362   6A 01            PUSH 1
00415364   E8 75D1A277      CALL kernel32.Sleep
00415369   E8 9286A477      CALL kernel32.IsDebuggerPresent
0041536E   83F8 01          CMP EAX,1
00415371  ^75 EF            JNZ SHORT CSuserCG.00415362
00415373   CC               INT3
00415374   83C4 04          ADD ESP,4
00415377   E8 94BCFEFF      CALL CSuserCG.00401010  ;go back
0041537C  ^E9 5AF9FFFF      JMP CSuserCG.00414CDB
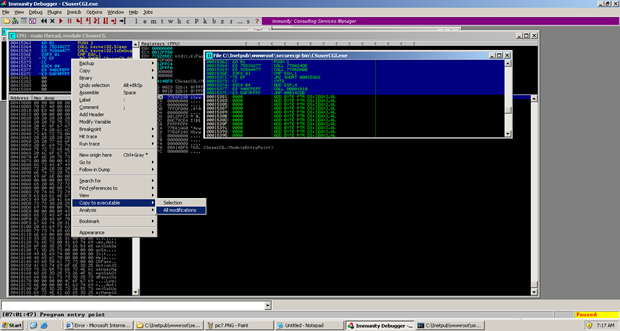
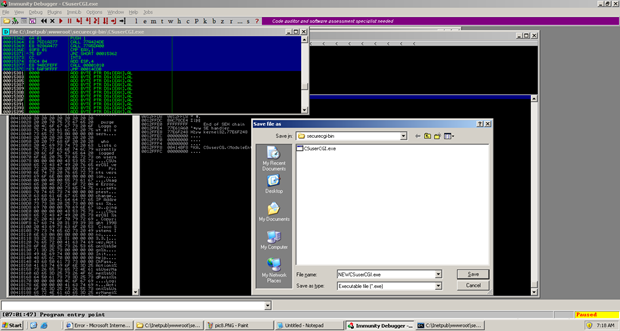
With immunity we can now right click and save the changes to a new name. I decided to name the file NEWCSUserCGI.exe and place it in our CGI script directory (C:\Inetpub\wwwroot\securecgi-bin).
I then renamed the original executable to OLDCSUserCGI.exe and then changed NEWCSUserCGI.exe to CSUserCGI.exe (which is the original name of the file)
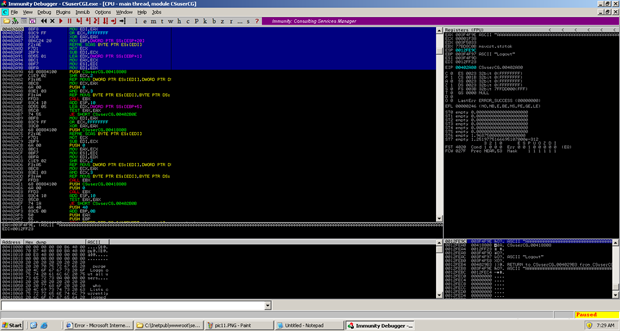
This time I launched with the proof of concept in our URL and viola the script is still running!
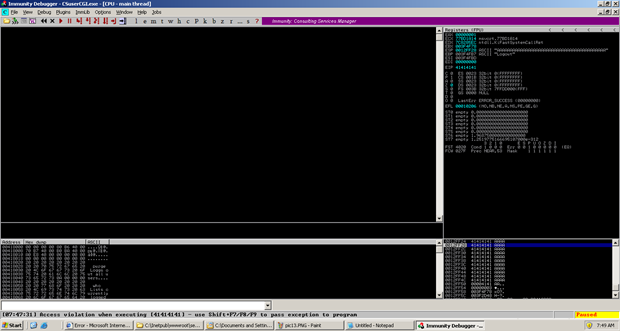
Now time to see our buffer overflow and to verify our public proof of concept code is working. If we take a look at (http://www.securityfocus.com/archive/1/489463 by FX) we can see that when we supply a long string after “Logout+” we will reach our buffer overflow giving us control of EIP
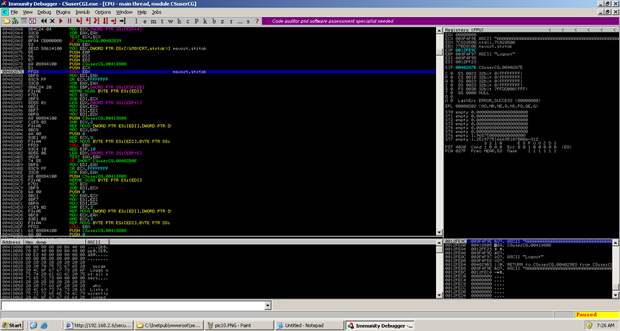
The vulnerable function is a subroutine in the function we hooked (0x00401010). First we can see a fixed buffer of 0x60 being setup for our Logout argument.
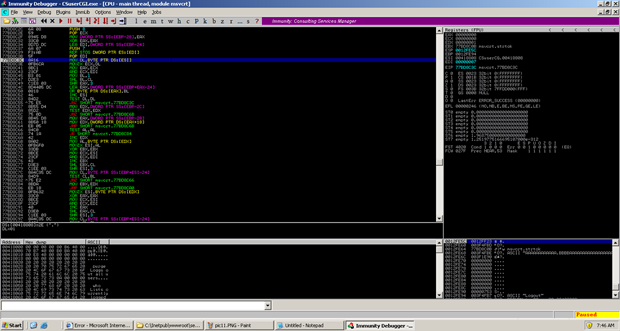
msvcrt.strtok is called and is looking for the first string that ends in “.”
The string is then copied on the stack and we eventually reach our buffer overflow.
Woot! This was an easy stack buffer overflow and the final code can be seen here: (https://github.com/rapid7/metasploit-framework/blob/unstable/unstable-modules/exploits/untested/cisco_acs_ucp.rb)
What about automating this?
I thought that this might be a good opportunity to create a script that would automate this process or come up with an alternative. I presented the idea to my teammates before leaving from work and drove home eager to give this a shot over the weekend. Low and behold I must have had a memory lapse and forgot that corelanc0d3r has over 5000 lines of python-fu with immunity (mona.py anyone?) and finished this before I even got home from work! All the credit goes to him for this one.
Here is his automated script that will essentially sleep the application until you attach the debugger and it does it all without calling any kernel32 API calls.
# binary patcher
# will inject routine to make the binary hang
# so you can attach to it with a debugger
#
# corelanc0d3r
# (c) 2012 - www.corelan.be

import sys,pefile,os,binascii

def patch_file(binaryfile):

	routine = "\x33\xc0"		# xor eax,eax
	routine += "\x83\xF8\x00"	# cmp eax,0
	routine += "\x74\xFB"		# JE back to cmp

	print "[+] Opening file %s" % binaryfile
	pe = pefile.PE(binaryfile)

	entrypoint = pe.OPTIONAL_HEADER.AddressOfEntryPoint
	base = pe.OPTIONAL_HEADER.ImageBase
	print " - Original Entrypoint : 0x%x" % (base + entrypoint)

	searchend = 0
	startrva = 0
	for section in pe.sections:
		if section.Name.replace('\x00','') == '.text':
			# code segment
			print " - Finding a good spot in code segment at 0x%x" % (base + section.VirtualAddress)
			print " Size : 0x%x" % section.SizeOfRawData
			searchend = section.SizeOfRawData
			startrva = section.VirtualAddress
			#print (section.Name, hex(section.VirtualAddress), hex(section.Misc_VirtualSize), section.SizeOfRawData )
	if searchend > 0:
		cnt = 0
		consecutive = 0
		stopnow = False
		offsethere = 0
		while cnt < searchend and not stopnow:
			thisbyte = pe.get_dword_at_rva(startrva+cnt)
			if thisbyte == 0:
				if offsethere == 0:
					offsethere = startrva+cnt
				consecutive += 1
			else:
				offsethere = 0
				consecutive = 0
			if consecutive >= len(routine)+5:
				stopnow=True
			cnt = cnt + 1
		print " - Found %d consecutive null bytes at offset 0x%x" % (consecutive,offsethere)
		print " Distance from original entrypoint : %x bytes" % (offsethere - entrypoint)
		jmpback = "%x" % (4294967295 - (offsethere - entrypoint + 4 + len(routine)))
		print " Jmpback : 0x%s" % jmpback
		routine += "\xe8"
		routine += binascii.a2b_hex(jmpback[6:8])
		routine += binascii.a2b_hex(jmpback[4:6])
		routine += binascii.a2b_hex(jmpback[2:4])
		routine += binascii.a2b_hex(jmpback[0:2])
		print " - Injecting hang + redirect (%d bytes) at 0x%x" % (len(routine),(base+offsethere))
		pe.set_bytes_at_rva(offsethere,routine)
		print " - Setting new EntryPoint to 0x%x" % (base+offsethere)
		pe.OPTIONAL_HEADER.AddressOfEntryPoint = offsethere
		entrypoint = pe.OPTIONAL_HEADER.AddressOfEntryPoint
		print " - Entrypoint now set to : 0x%x" % (base + entrypoint)

		print "[+] Saving file"
		pe.write(filename=binaryfile.replace(".exe","")+"_patched.exe")
		print "[+] Patched."
	else:
		print "[-] No code segment found ?"

if len(sys.argv) == 2:
	target = sys.argv[1]
	if os.path.exists(target):
		patch_file(target)
	else:
		print " ** Unable to find file '%s' **" % target
else:
	print "\nUsage : patchbinary.py filename\r\n"
What corelanc0d3r did was take advantage of pefile, a python module that allows us to read and work with PE (Portable Executable) files. (This module is installed by default on BackTrack and Immunity Debugger, just for your information)
His script will load the executable file and get the original entrypoint of the module.
Next, the script will look for a location in the file that has 12 consecutive null bytes (you could replace this with for example NOPS if needed).
At that location, an custom routine will be placed. This routine will clear out EAX, compare it with 0, and then jump back to the compare statement if the condition is true. Essentially this will be a loop until we attach our debugger. After the conditional jump (which ensures the loop), a call to the original location of the entrypoint is placed. Finally, the entrypoint RVA in the PE file is updated to point at the custom routine.
In other words, when you would run this executable, it would just hang (infinite loop). When attaching a debugger the process will pause. You then only need to find the location where the custom asm routine was inserted (the address is, in fact, right after the updated entrypoint), and either replace the cmp instruction with nops, or just change the cmp eax,0 into cmp eax,1. If you would continue to run the process, the executable would simply start doing what it’s supposed to do. Alternatively, you can just let the application run and then pause (break)… it would halt on the cmp or the jump instruction inside the custom routine.
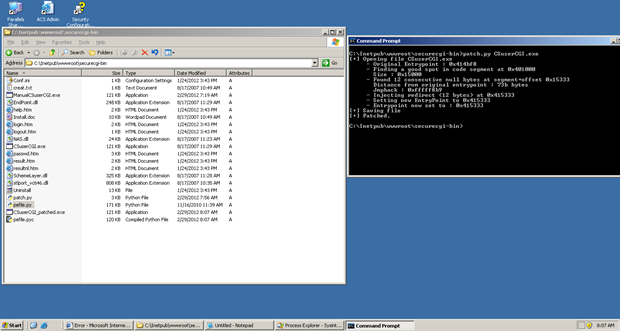
Lets go ahead now and run this from cmd.exe and see everything work automatically.
After the script finds and writes to a safe place for the loop, it will save a new file with the filename and “_patched.exe”.
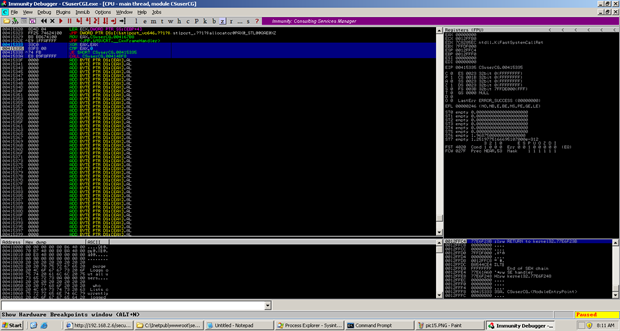
If we go ahead and run we can see that it works and does the same thing as my manual patch.
Now if we rename our patched file and run our proof of concept again we can then attach the debugger and press “pause” to stop the loop. We then break out of the loop and the call back to the original entrypoint will be executed.
Woot! Looks like everything is working properly. So that’s pretty much it, this is just a short article on a problem I encountered and how it was solved. Note that this technique most likely won’t worked with packed/encoded binaries…
Windbg ?
You can, of course, do the same thing with other debuggers as well. The basic procedure will be exactly the same, you only need to know how to edit the instruction in memory to break out of the loop.
Let’s say you want to change the CMP instruction into CMP EAX,1. This requires us to change one byte in memory (the byte at 0x00415337 in this case).
With the debugger attached (and the process interrupted), simply run the following command:
eb 0x00415337 0x01
eb = edit byte. Other windbg ‘edit’ commands are ew (edit word) and ed (edit dword).
Afer making the change, press F5 (or type ‘g’) to let the process break out of the loop and return to the original entrypoint.
Update (march 1st 2012)
As various people on twitter suggested, you can obviously also use \xeb\xfe as patch routine (which will just jump to itself). Tx @fdfalcon and @pa_kt for the good feedback !
© 2012, Corelan Team (Lincoln). All rights reserved.
